A Lasting Teaching Moment: The Colorado Flood
Resources for the classroom
Permalink to Resources for the classroomColorado Flood
Permalink to Colorado Flood
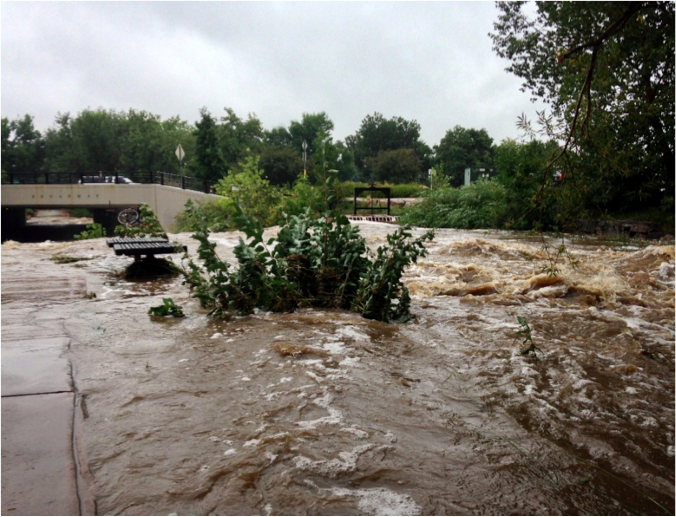
Boulder Creek, September 2013 in Boulder, CO photo courtesy of Kelly Mahoney, NOAA
Flash flood awareness in our community is critical as demonstrated by the historic local floods of 2013. As a teacher you can greatly increase flash flood awareness and our communities’ resilience through your science curriculum. This 1-day lesson plan addresses your students’ most important questions about the floods and helping them to utilize NOAA, UCAR, and CoCoRaHS evidence to answer: What happened? What’s the likelihood it will happen again? Am I at risk? Does climate change play a role?
Presentation Slides
Permalink to Presentation SlidesCoopertive Institute for Research in Environmental Sciences (CIRES) presentation slides created by Kelly Mahoney, and National Weather Service (NWS) presentation slides created by Robert Glancy & Nezette Rydell local forecast office. These can be used for classroom lecture or to answer frequently asked questions.
Colorado Flood Jigsaw
Permalink to Colorado Flood JigsawGroup research lesson plan by NOAA.
A standards-based classroom lesson utilizing valuable resource links and information related to many aspects of the flood. Students will increase their scientific literacy by reading and summarizing web articles and information, in order to become “experts” on the following topics: Data, community impact, weather, historical floods, and climate change impacts on floods.
Flash Flood Teaching Box by UCAR
Permalink to Flash Flood Teaching Box by UCARFlash Flood Teaching Box — filled with explorations and readings that help secondary students learn the science of flash flooding. Students will learn that storms with unusually heavy rainfall can cause a flood, that the shape of the land and the ability of the ground to hold water influences whether a flood is likely, and they will learn how flash flood risk and probability is assessed. Get your feet wet by bringing the science of flash floods to your classroom. Spark Teaching Boxes are themed collections of classroom-ready educational resources to build student understanding of science, technology, engineering, and math (STEM). Resources highlighted within teaching boxes are from various science education programs and all have been vetted by the Spark education team.
How Boulder’s Resilience Strategy Saved It
Permalink to How Boulder’s Resilience Strategy Saved ItThis YouTube video about the Colorado Floods from the article You Can’t Stop Urban Flooding discusses the city’s flood-mitigation mechanisms. “When one of the worst floods in Colorado history barreled through Boulder, the flood-mitigation mechanisms that the city had been implementing for decades were finally put to the ultimate test.” Published Jan 27, 2014.
YouTube Satellite Data Video and Commentary
Permalink to YouTube Satellite Data Video and CommentaryA short Infra Red (IR) Satellite data clip from Science On a Sphere® showing ten days in September 2013, which encapsulates both before and after the Colorado Floods. Weather icons have been superimposed over the satellite data in order to help illustrate the atmospheric factors that led to intense rains which caused the flooding. Commentary for the video is as follows:
- Tropical Storm Lorena from the Pacific Ocean and Tropical Depression 8 from the Atlantic dissipate over Mexico leaving behind an upper level low pressure
- The warm core upper level low pressure moves north and parks over Utah
- As with any low pressure, the air rotates counterclockwise and inward pulling the warm, moist remnants of the tropical systems towards the Front Range of Colorado
- As with any moist air, as it hits the mountains it rises and forms rain
- General circulation of air in the mid-latitudes moves air west to east but the high pressure ridge to the east serves as a stalling feature, keeping the low in place for a few days
- A cold front from Canada moves south to Colorado and reinforces the uplifting motion as cold air is denser and plows under the warmer air causing another couple of days of rain
- These factors caused ~18" of rain to fall within a week in Boulder and more than 8" of rain over a large area of the Colorado northern foothills, which brought widespread flooding. This water washed out nearly every road in Boulder County that leads to the foothills and ultimately swelled riverbanks in Nebraska
- This dataset can also be seen on the NOAA Boulder Science On a Sphere® (SOS)
Teacher Resources: Overview of 2013 Colorado Flood
Permalink to Teacher Resources: Overview of 2013 Colorado FloodSOS Explorer: An SOS Dataviewer for the Classroom - coming soon!
Permalink to SOS Explorer: An SOS Dataviewer for the Classroom - coming soon!
In the meantime, here is a list of the SOS datasets you viewed at the workshop. The flow and purpose for each of the datasets in the presentation are as follows (links take you to website descriptions):
Review of general circulation, heat transport and introducing atmospheric rivers:
Daily, seasonal, inter-annual temperature & precipitation variability:
Extreme Events, can impact farms, communities, state & federal government:
Climate Change is an overall increase in air temperature, which also increases atmospheric water vapor (a greenhouse gas) concentrations and might also increase extreme rain events. Below you can visualize observations of water vapor trends, global temperature rise and a model of expected temperature rise in the future:
Human Forcing is what we attribute the change in climate due to the release of carbon dioxide from burning fossil fuels to “fuel” the modern world:
Questions?
Permalink to Questions?Send an email to Hilary Peddicord.