Finding/Manipulating Point Data
For the purpose of this tutorial, I will create a map with the locations of nuclear reactors plotted against earthquake danger zones.
I’m using a map with a transparent ocean as a base map, so that it’s easy to see what I’m doing during this tutorial. To insert it, see the “Base Maps with Raster Data” section of this tutorial on page 6. I found my reactor data in spreadsheet form on The Guardian’s datablog. To download it, click on the link right under the title that says “Get the data.” This takes you further down the website to a link that says “DATA: Download the full spreadsheet.” Click on that link and save it in a place you’ll remember.
Once you’ve downloaded the spreadsheet, you’ll notice that while it does include coordinates, they have both latitude and longitude in the same column. QGIS won’t be able to plot the data unless latitude and longitude are separate. This is frequently the case with online databases, so I’m going to document the trick I use to separate the column into two.
If you are using a spreadsheet that already has latitude and longitude in separate columns, skip to Adding the Data to QGIS.
Splitting a Column with Google Sheets
Permalink to Splitting a Column with Google SheetsIf you prefer using Microsoft Excel, follow their tutorial on splitting text into different cells and skip down to Adding the Data to QGIS.
- Open a new Google Spreadsheet
- Copy and paste your data into the sheet
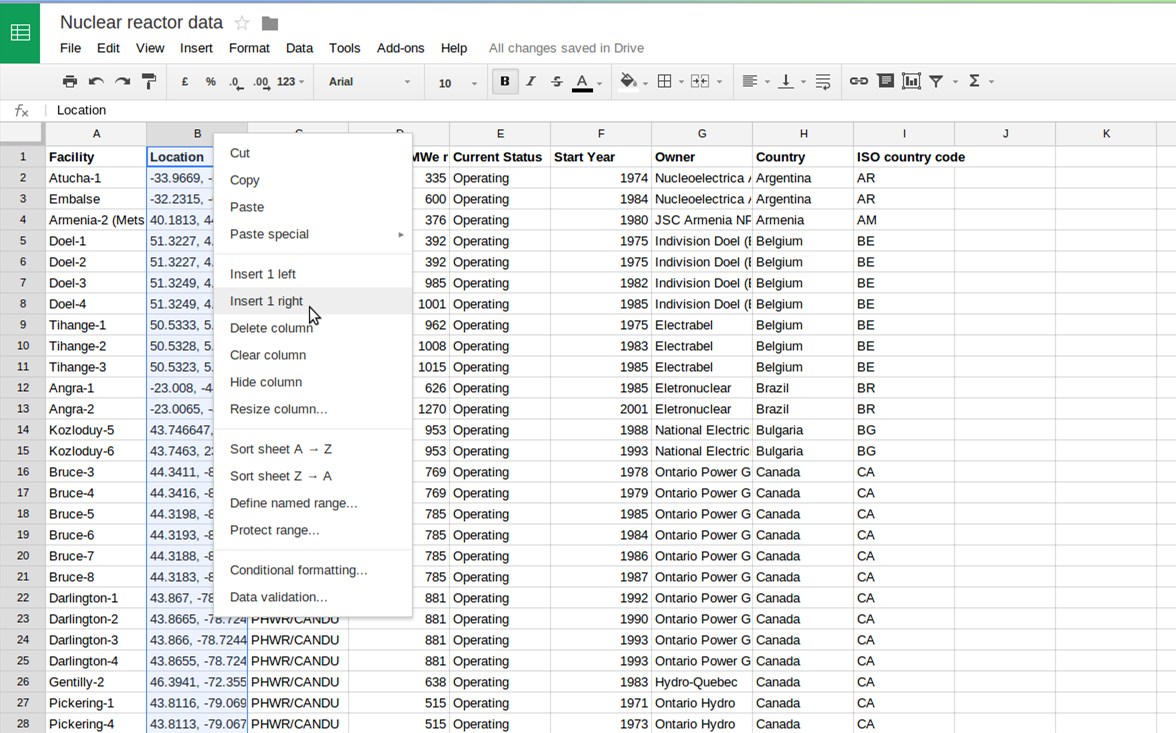
- Insert two extra rows next to the coordinates’ column, in the same spreadsheet. Do this by right-clicking on the column header and selecting Insert 1 right. Do this twice
- Click on cell C2. Go to the formula bar located directly above the column headers. Type in the formula =SPLIT(B2, “,”). This will split cell B2 where the comma appears, putting the split halves into cells C2 and D2. It will also make sure the comma isn’t copied into the new cells
- Right-click to copy cell C2. Select the remainder of column C, down to where your data ends. Right-click to paste the formula in C2 into the rest of your selection
- Label your new columns “latitude” first and “longitude” second
- Now go to FileDownload AsComma Separated Values (.csv) to save your spreadsheet

Insert new columns by right-clicking on a column header and selecting Insert 1 right. Use the formula bar (located just above the column headers) to enter the formula to split a column.
Adding the Data to QGIS
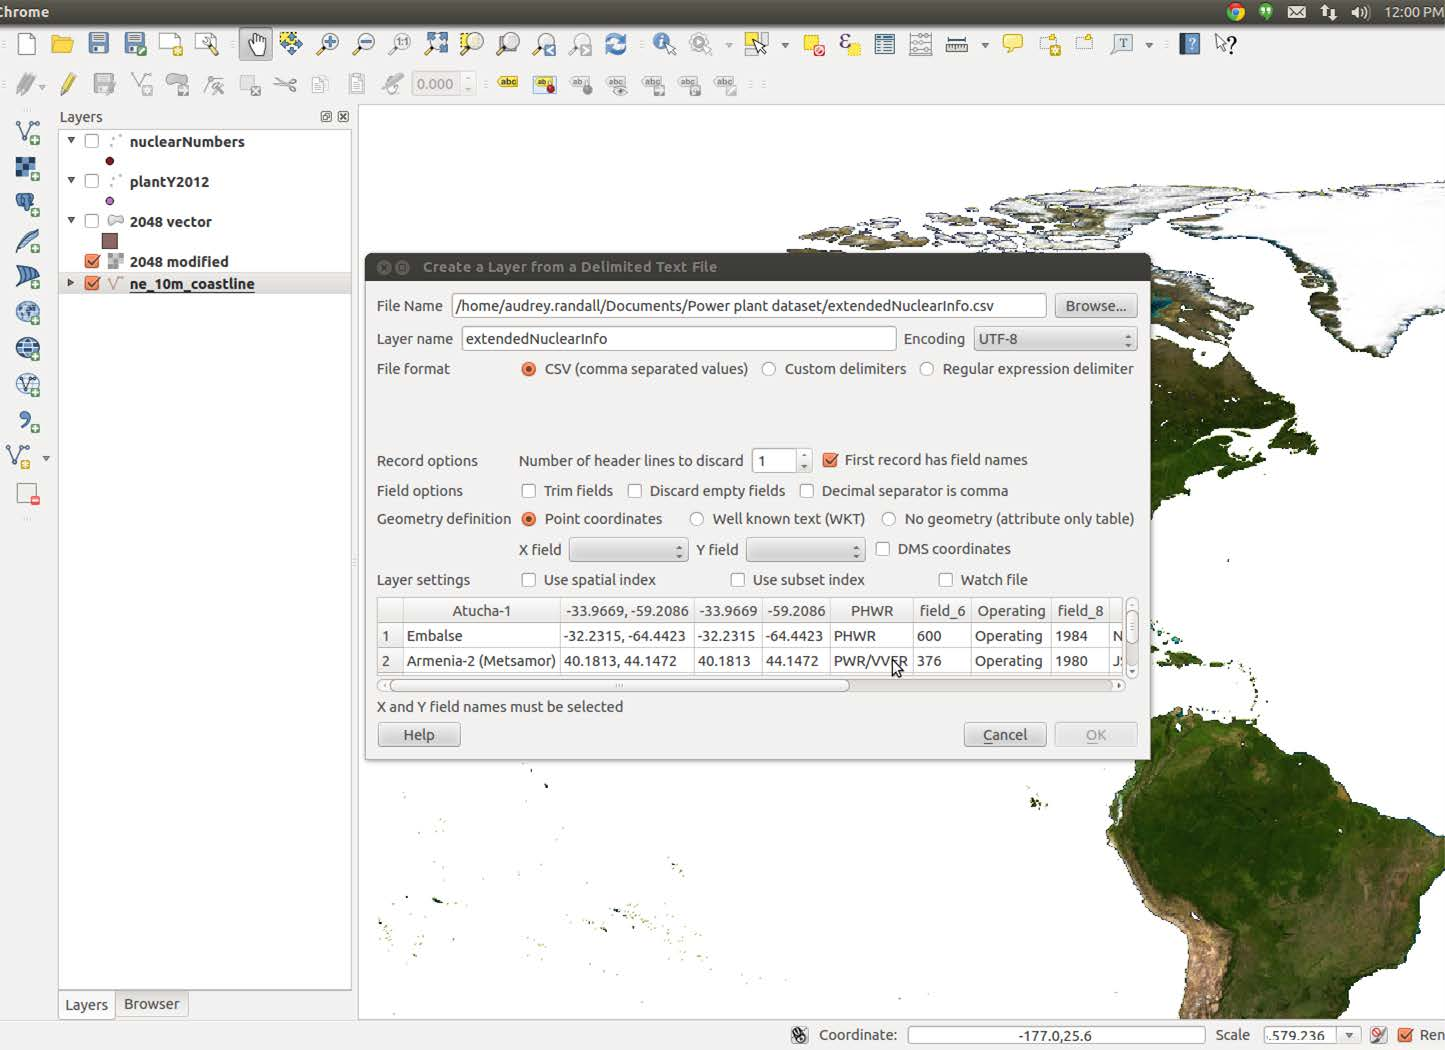
Permalink to Adding the Data to QGISIn QGIS, click the add delimited text layer button or go to LayerAdd Delimited Text Layer. Select the file you want to upload (that’ll be our nuclear data file).

Use the Browse button to choose your data file, then select the columns for your longitude and latitude values for the X field and Y field, respectively.
For the X field, pick the column name for your longitude value (probably “longitude”, if you’re following along with the example). Choose the column containing your latitude value (named “latitude” in my example) for the Y field. Click OK.
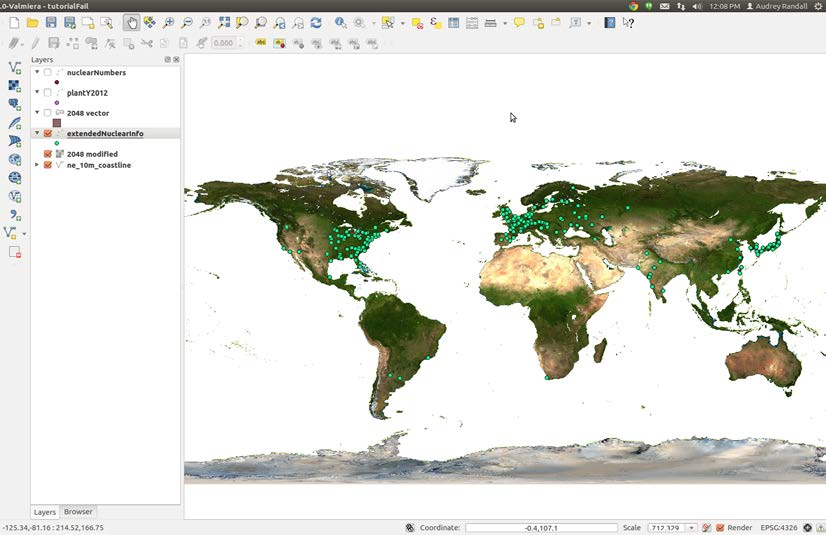
A dialog box will come up prompting you to choose your projection. Pick WGS 84 and hit OK. Huzzah, we have a map of reactor locations! For information about how to change the color and style of the points, see the next section.

Your map in QGIS should look like this after loading the nuclear reactor data from your CSV