Exporting Maps as Layers
Sometimes it can be advantageous to have all the layers of your map as separate image files, so that they can be turned off and on as you wish. For example, I’m saving the nuclear power plant locations as a separate PNG from the earthquake data, in case some users just want to talk about one or the other. To save the layers of your map as separate files, simply uncheck the boxes next to each of the layers that you don’t want visible, and arrange the remaining layer(s) for the print composer just as you would for a full map (For guidance on how to do this, please see the section labeled Exporting Maps as Images.)
I also want to create layers of different years of earthquake data, because I have data from four thousand years ago and it would be neat to show the earthquakes accumulate, layer by layer. I’m going to split it up into chunks of 200 years. To do so, I’m going to create a layer of data for each one, and then I’m going to arrange each layer in the print composer.
Splitting Data
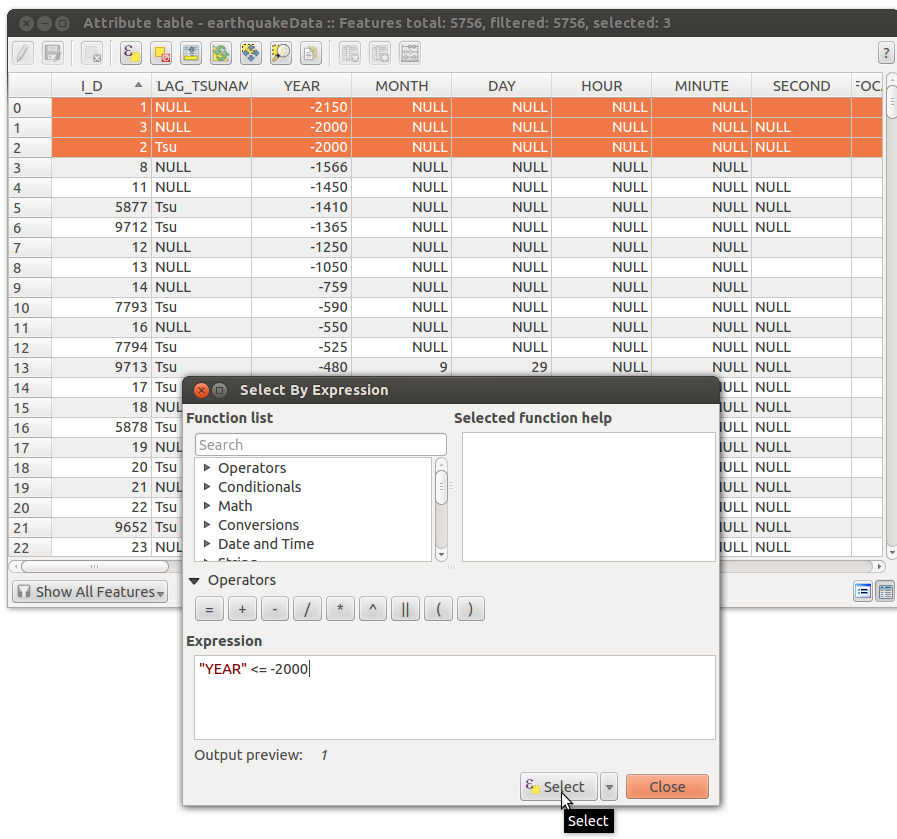
Permalink to Splitting DataTo split up the layers of data, right-click on the layer name and select Open attribute table. Click on Select features using an expression. If you don’t remember from the steps above, that’s the button at the top that has an epsilon (ε)on it. In the Expression window, we need to tell QGIS to select all the elements of column YEAR that have values within a certain range. The formula to do so is "YEAR" <= -2000. Type this into the Expression window.

Use the Select By Expression to select rows based on the YEAR column.
To explain what this formula means: We want to select the values in the YEAR column, by putting the column name in quotes (without the quotes, QGIS thinks you’re referring to the column itself, rather than each value within the column). The first range of years we’re selecting is anything older than 2000 BCE, so we use the formula “YEAR” <= -2000 to say “The values in column YEAR that are less than (<) or equal to (=) -2000.”
Once you have a selection, right-click on the layer name and click Save selection as. Save as an ESRI shapefile in a folder you’ll remember and import the resulting layer to QGIS by checking the Add saved file to map and pressing OK.
Next, we need to select values between two numbers. We do so by adding the keyword AND to tell QGIS to find points that satisfies both conditions. To find earthquakes between the years 2000 and 1800 BCE, not including 2000, the expression is “YEAR” > -2000 AND “YEAR” <= -1800. Note that “YEAR” > -2000 AND <= - 1800 is not a valid statement.
Repeat these steps as many times as you need. For this map, since our color style drops any point with an intensity value of NULL, I’m also making a layer with the command “INTENSITY” IS NULL added onto my year specifications for each set of 200 years, like so: “YEAR” > -2000 AND “YEAR” <= -1800 AND “INTENSITY” IS NULL.
Styling Each Layer
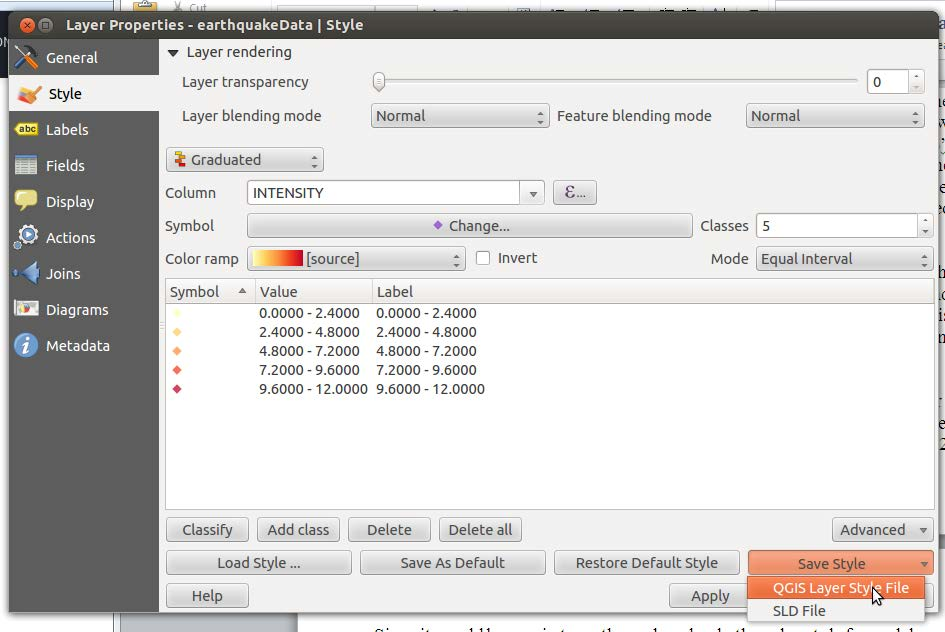
Permalink to Styling Each LayerSince it would be a pain to go through and redo the color style for each layer, I’m going to go to Properties (right-click layer name and select Properties) for my earthquakeData layer and save the style I’m using as a QGIS layer style file. I’ll do the same on the null intensity layer. As a result, I can use the Load Style… button to copy those styles to any other layer.

You can save the style of a layer as a separate file for reuse in the Style tab of the Layer Properties dialog.
However, this method seems to be a bit buggy, so another, simpler way to do this is to right-click a layer and select Copy Style, then right-click the new layer and select Paste Style.
Exporting Layers
Permalink to Exporting LayersOnce all the layers are created, it’s time to export them all as PNGs. Remember to save them with useful names! See the Content Creation Guidelines for nomenclature guidelines. Arrange your images in the Print Composer the same way we did for a full map, but this time, make sure that only the layers you want to export are visible in QGIS’s main window. Make sure that you right-click on one of the layers that covers the full extent of the map, like the background image layer, and select Zoom to layer extent, or your points will be in the wrong places.
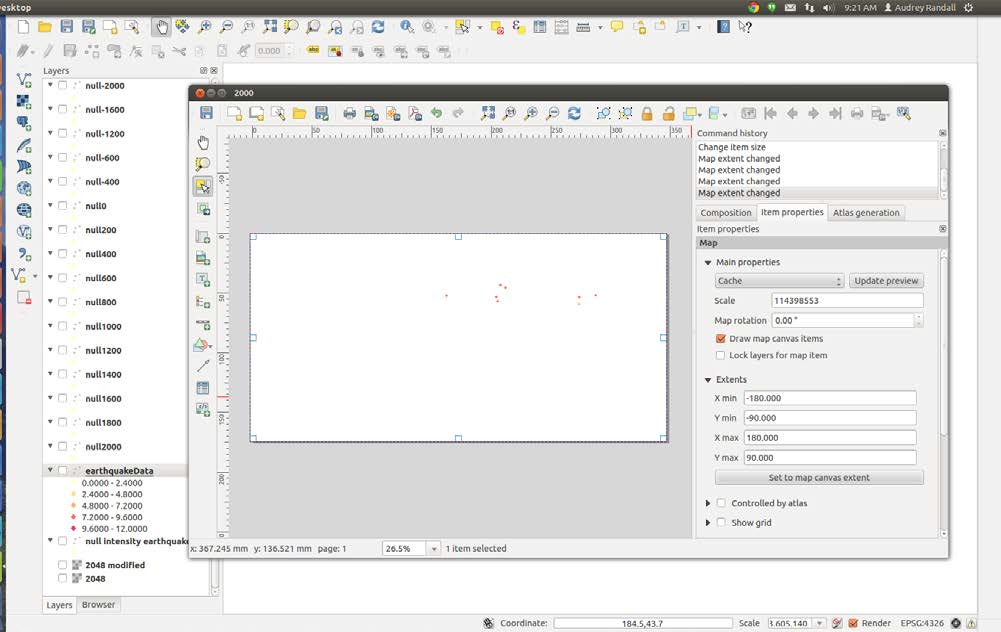
You can use one composer to export all your images; just select the layers that you want in each one and press the Update preview button on the Item Properties menu. See the Exporting Maps as Images section of this tutorial for detailed instructions.

Export an individual layer by toggling the visibility of all other layers off and exporting it with your print composer.
Remember to make sure that your DPI is set to 300, your paper size is custom and set to 6.83 by 3.41 (this gives us the correct pixel size of approximately 2048 by 1024), and your Extents are set to -180, -90, 180, and 90.