Precipitation Departure - LA Fires
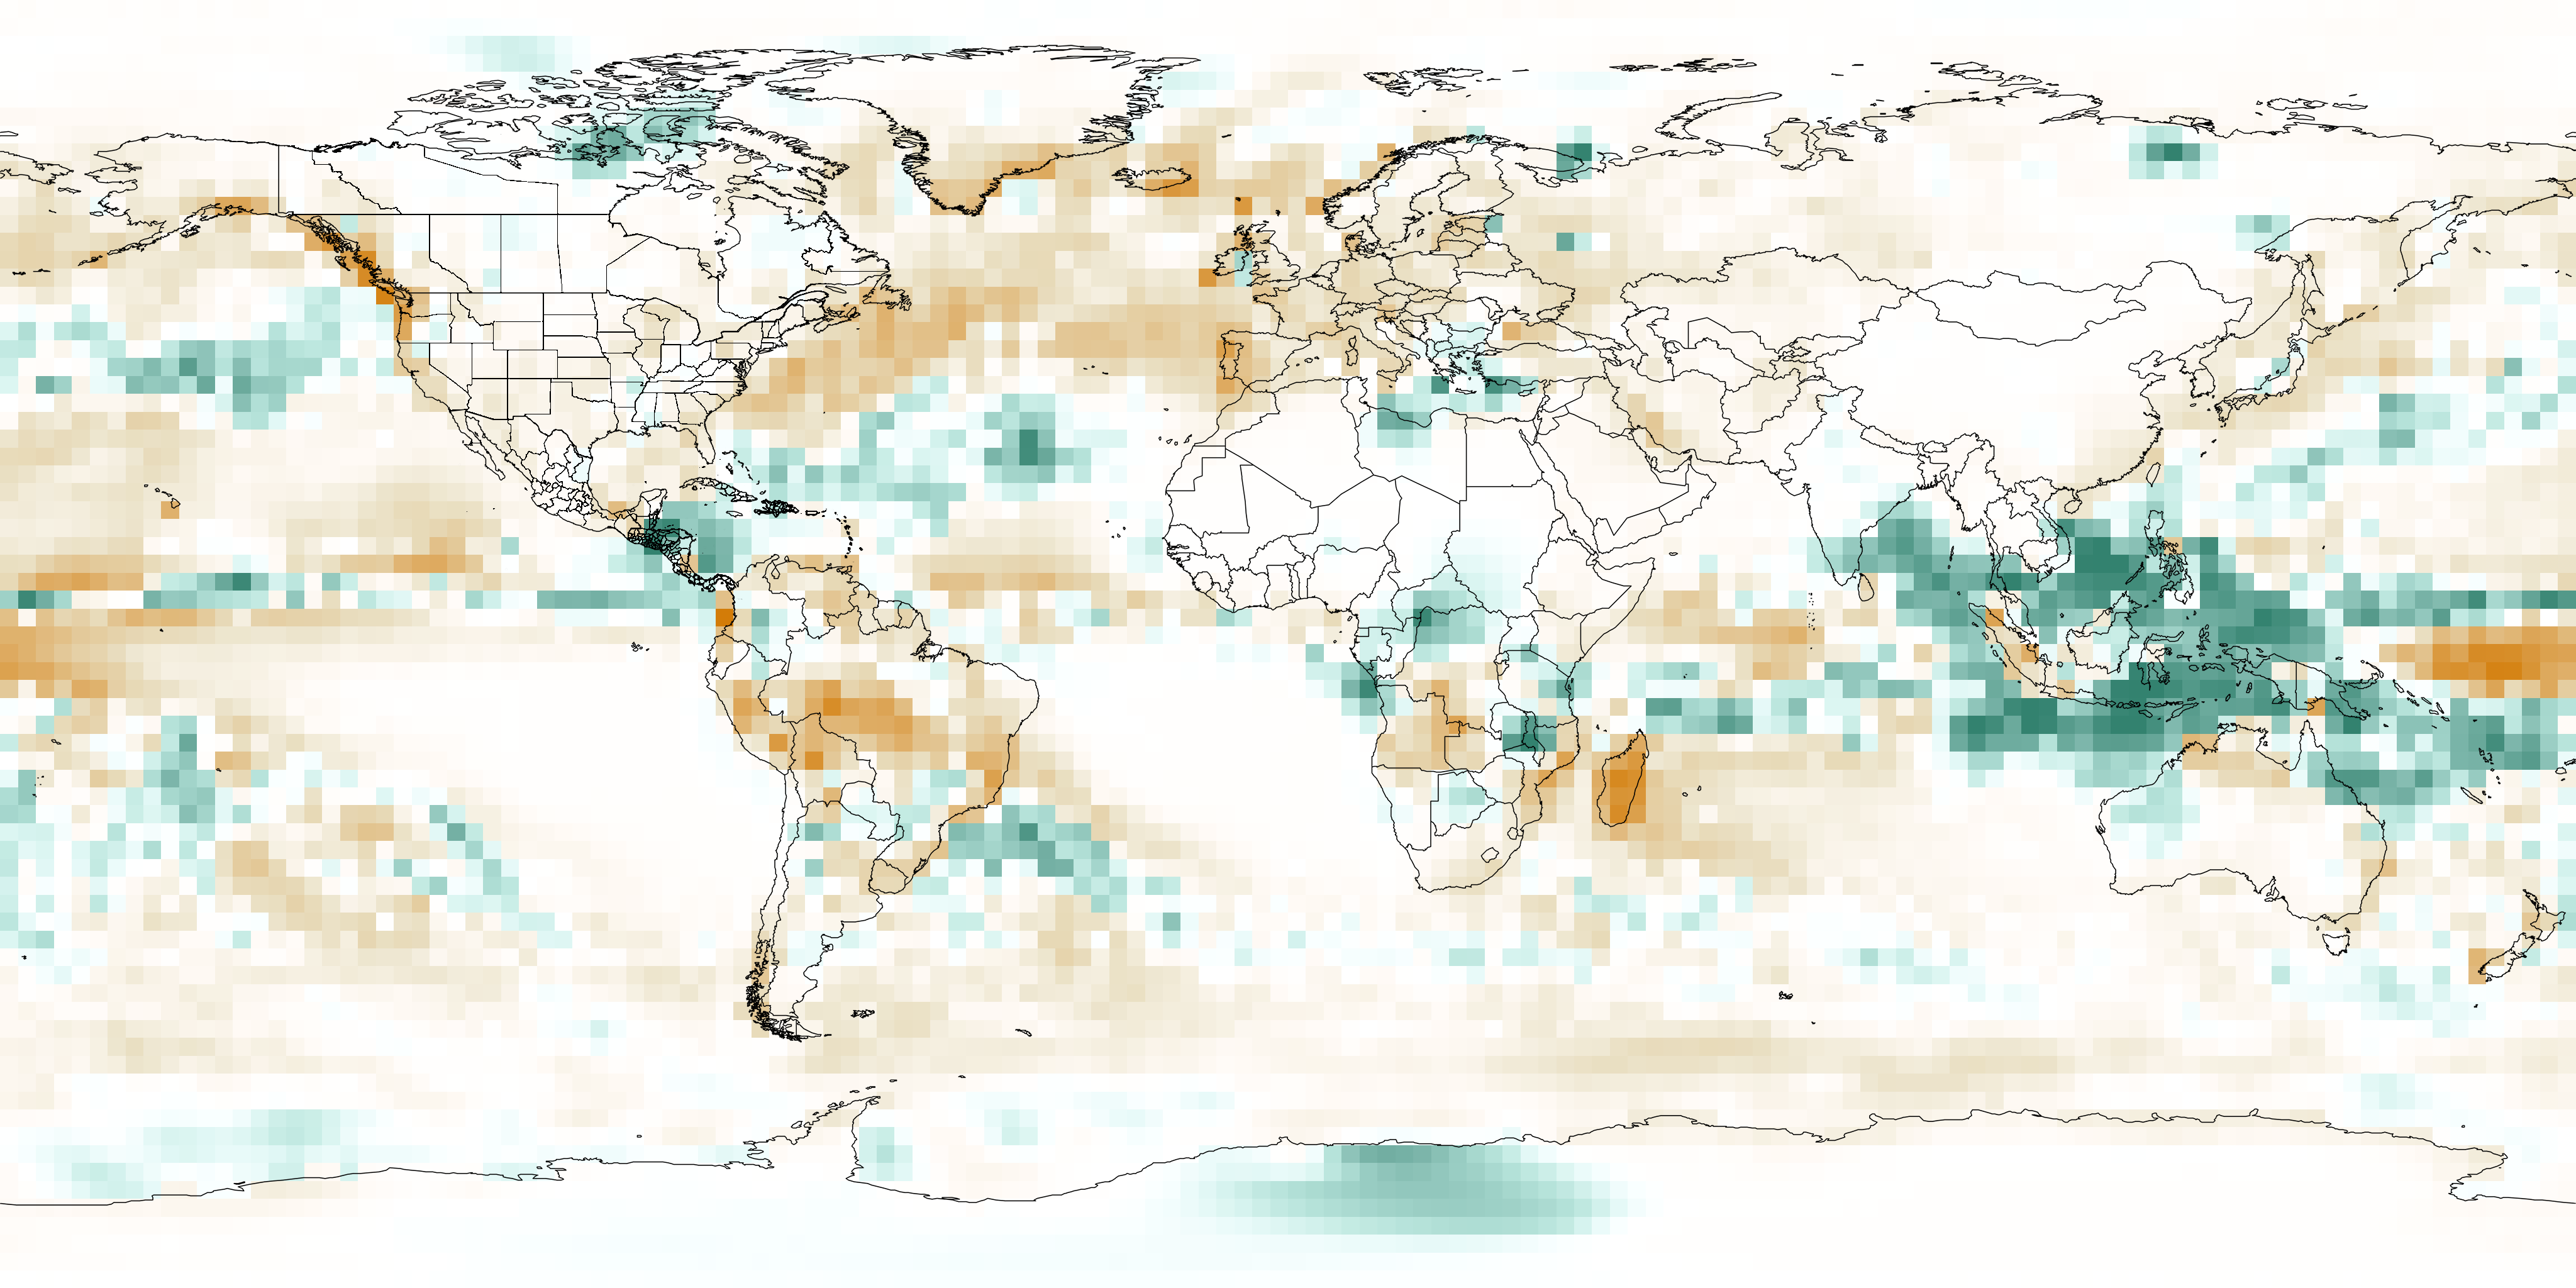
By comparing precipitation to a 30-year average, we can identify areas that may be at risk for drought. In this lesson, students will closely observe a map showing precipitation departures from normal, then zoom in to focus on North and South America. Working in pairs, they will analyze and discuss key figures, including a drought severity map of the Southwest and a bar chart showing the overlap between dry periods and the windy season. Through this activity, students will strengthen their skills in interpreting visual data and making evidence-based connections.
What’s happening in this map? What do you notice that makes you think that?
In this short activity, students will strengthen their critical thinking skills by carefully observing the data, forming ideas, and backing them up with evidence.
While the main goal is to encourage slow, careful observation, this activity also connects to topics like precipitation, drought, winds, climate normals, fire, and weather. If you’re covering any of these, this could be a great addition to your unit. In the reading extention, students pair up, choose an article from NOAA Features wildfires content, summarize, pair-share and present to the class.
Date and Grade Relevance
Permalink to Date and Grade Relevance- Week 6 - Published February 24, 2025
- Best suited for 9-12+ grades
- NGSS - HS-ESS3: Earth and Human Activity