Energy Poverty
Details
Permalink to Details- Added to the Catalog
- Available for
- SOS
- Categories
- People: Live Programs
Description
Permalink to DescriptionThis 2017 Science on a Sphere (SOS) Student Contest winning submission. Read more about the contest and the winners here. This project is the first of four lesson packages that make up the authors' larger Senior Capstone Project in the Department of Integrated Science and Technology at James Madison University. Each of the first three lesson packages includes a background analysis, a comprehensive lesson plan, supporting teaching and learning resources, and SOS datasets for select energy poverty indicators, such as access to non-solid fuels (percent of population by country). These lessons explore the nature and consequences of energy poverty and are presented on SOS. Data for the sphere datasets were obtained from the World Bank's Data Catalog and the Center for International Earth Science Information Network. Datasets were created in ArcGIS and exported as individual, static image files (JPEG) for SOS.
The purpose of this project was to develop a set of university-level teaching and learning resources about energy poverty that incorporate a spherical display system, SOS. Energy poverty, commonly understood as the lack of access to clean cooking fuels and electricity, is a complex problem that has detrimental health, economic, social, and environmental effects for both the people living in it and the global community. Furthermore, people living in energy poverty are trapped in a cycle of impoverishment because energy poverty interacts in a reinforcing feedback loop with global poverty. Individuals and societies suffering from energy poverty cannot escape it on their own, and combating the issue requires action from developed countries. The goal of this project was to increase awareness of energy poverty among university students, and SOS was incorporated to facilitate students visualizing differences in energy access and the resulting consequences on a global scale.
NOAA's mission involves predicting changes in the climate and fostering an understanding of the causes and consequences of climate change. This project informs on NOAA's climate science mission because energy poverty can act as a cause of climate change. People living in energy poverty burn solid fuel sources like fuel wood, agricultural residue, and charcoal for cooking and heating needs. However, these low-quality fuels release carbon emissions when burned in unclean and inefficient facilities, making them a contributor to climate change.
Furthermore, people living in energy poverty must obtain access to modern and advanced energy services. Many developing countries are trying to achieve this through fossil fuels instead of renewable energies. An increase in use of fossil fuels will cause a significant increase in carbon and greenhouse gas emissions due to the combustion of larger volumes of fossil fuels. This will further escalate climate change and degrade environmental health. To further complicate the problem, the populations of many countries experiencing energy poverty are also increasing substantially, meaning larger energy needs will need to be met. To understand the causes of climate change, it is first important to understand energy poverty.
This lesson is a step toward achieving public understanding of energy poverty as a climate change contributor. This ties very closely to NOAA's mission of predicting changes in climate and understanding causes of climate change, because the energy practices of those living in energy poverty affect climate change, and developing countries and their changing population dynamics will determine future climate effects. The elimination of energy poverty is necessary to end suffering, but carrying it out with modern fossil fuels can lead to increased climate change and environmental degradation.
Resources
Permalink to ResourcesCredits for each dataset:
Permalink to Credits for each dataset:Nighttime Lights
Nighttime Lights shows the Earth at night with lights generated by electricity. The data were recorded by the Defense Meteorological Satellite Program (DMSP) in the National Geophysical Data Center (NGDC), and aggregated by the Earth Observation Group.
Population Density
Permalink to Population DensityThis dataset shows the gridded population of the world in number of people per square kilometer. The data were obtained from the Center for International Earth Science Information Network (CIESIN)'s “Gridded Population of the World, v4” dataset. Center for International Earth Science Information Network – CIESIN – Columbia University. 2016. Gridded Population of the World, Version 4 (GPWv4): Population Density. Palisades, NY: NASA Socioeconomic Data and Applications Center (SEDAC). Retrieved from Data file.
Population Density at Night (2000)
Permalink to Population Density at Night (2000)This dataset combines population density (CIESIN) with night-lights data (DMSP) to show the distribution of human population across the world in comparison to where lighting generated by electricity exists. This image was generated and obtained from the National Aeronautics and Space Administration (NASA). National Aeronautics and Space Administration (NASA)/Goddard Space Flight Center; Defense Meteorological Satellite Program (DMSP); Center for International Earth Science Information Network (CIESIN). (2007). Population Density at Night link.
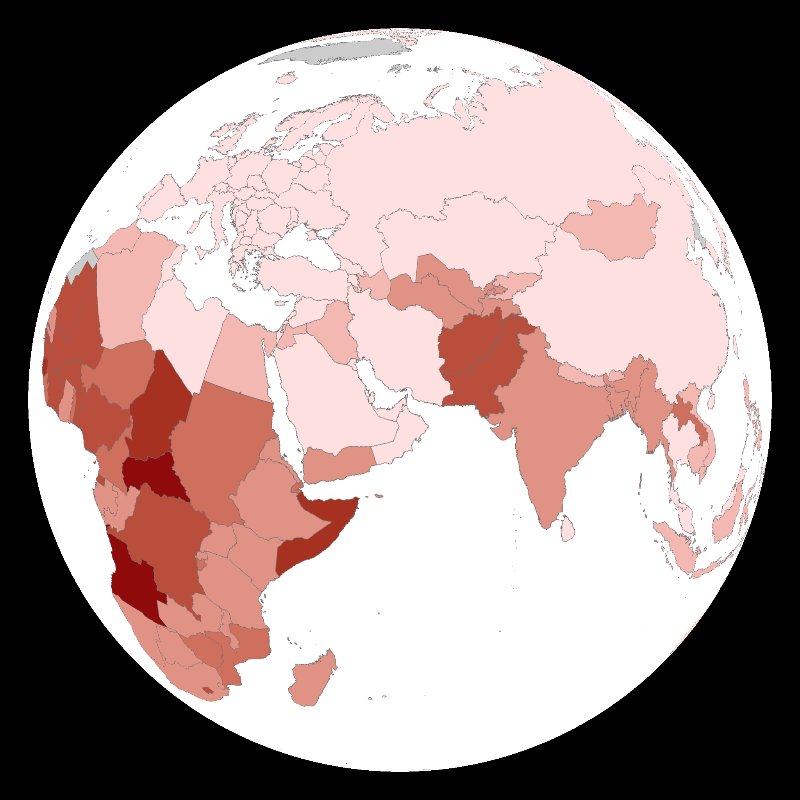
Non-Solid Fuel Access
Permalink to Non-Solid Fuel AccessThis dataset shows the percentage of the population in a country that has access to non-solid fuels. The data were obtained from the World Bank's Sustainable Energy for all (SE4ALL) database from the WHO Global Household Energy database, and compiled on a world dataset using ArcGIS for the purposes of this project. The image is included in the 'Datasets (Images)' section of this manual. World Bank, Sustainable Energy for all (SE4ALL) database from WHO Global Household Energy database. (2012). Access to non-solid fuel (% of population). Data file.
Electricity Access
Permalink to Electricity AccessThis dataset shows the percentage of the population in a country that has access to electricity. The data were obtained from the World Bank's Sustainable Energy for all (SE4ALL) database from the World Bank Global Electrification database, and compiled on a world dataset using ArcGIS for the purposes of this project. The image is included in the 'Datasets (Images)' section of this manual. World Bank, Sustainable Energy for All (SE4ALL) database from World Bank, Global Electrification database. (2012). Access to electricity (% of population). Data file.
GDP PPP Per Capita
Permalink to GDP PPP Per CapitaThis dataset shows the global differences in GDP PPP per capita on the country level. The data were obtained from the World Bank's International Comparison Program (ICP) database, and compiled on a world dataset using ArcGIS for the purposes of this project. The image is included in the 'Datasets (Images)' section of this manual. World Bank, International Comparison Program database. (2015). GDP (current US$). Data file.