Dataset Considerations
Orientation of Data
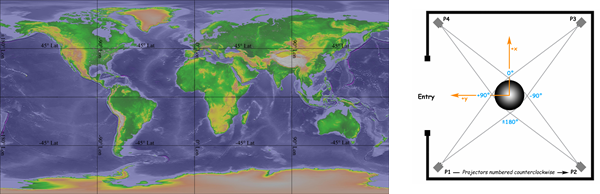
Permalink to Orientation of DataThe maps created for SOS should be centered on the Prime Meridian, so that 0°N,0°E is the center of the image, as seen below left. The map on the next page is from the dataset in the extras category called SOS Coordinate System that is useful when learning how datasets are loaded on the sphere. The center of the map loads between projectors three and four with the edges of the map lining up between projectors one and two, as seen in the diagram to the right of the map.
Seams
Permalink to SeamsIt is important that the data fill the entire image space. If there are borders or extra space around the edges of the image then a seam will appear on the sphere as a vertical white line with spots on the poles. It is also important that the data match on either side of the edges of the image, otherwise you’ll end up with a discontinuity running vertically along the visualization.
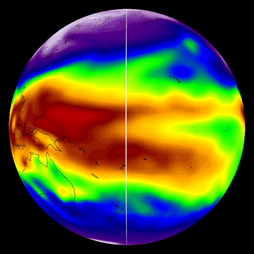
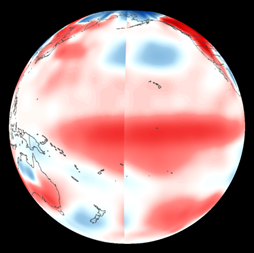
Examples of seams. The first image shows a seam caused by a border around the image. The second image is a discontinuity caused by the fact that the left edge of the visualization does not match the right.
In addition to making sure that the data fills the entire frame, from 180° West to 180° East, also make sure that the data fills the entire frame from 90° South to 90° North. If there is missing data at the poles, fill in the area with a solid color or a basic land/ocean background to ensure that the dataset wraps properly around the sphere without stretching vertically.
Warping
Permalink to WarpingWhen working with a spherical surface, warping is always something to consider. The least amount of warping occurs near the equator, while the most warping occurs at the poles. Because of this, it is recommended that any text and labels are placed near the equator. Supplementary text, labels and images that are displayed as PIPs don’t warp if their position is set with the pipcoords attribute in the playlist. Datasets can be tested for warping issues using CC Sphere in Adobe After Effects or 3D Sphere in Photoshop. There are some plugins for After Effects such as Cycore Effect’s Sphere Utilities that can also help with spherical warping. In addition, these programs can be used to check for seams.
Color Suggestions
Permalink to Color SuggestionsA color scale can dramatically change the emphasis and message of a dataset. Because of this, the Science On a Sphere Users Collaborative Network has had many discussions on the color scales that are used for SOS datasets. The goal is to create datasets with well-chosen color scales that are meaningful, intuitive, and scientifically accurate. Several conclusions are the result of these discussions:
- It can be confusing to users when the same color scheme and their associated color bars are used for two completely unrelated datasets
- The same color should not be used to represent more than one thing. i.e. if ice is shaded white, then white should not also be used for areas of missing data
- Using rainbow-colored legends and color schemes is often confusing to the audience and hard to parse. Instead, consider using shades of green to represent phytoplankton, and blue and red gradations to represent temperature anomalies. i.e. use “meaningful” colors
- Avoid using full sphere backgrounds that are completely or pre-dominantly white. The seams between projectors become more apparent when using solid white/bright backgrounds. f using bright background colors, consider adding some noise/texture to them. Same goes for PIPs, especially those displayed at the seams between projectors
ColorBrewer is a good resource for helping you choose a color scheme for your visualization.
Frame Rate
Permalink to Frame RateYou can animate a time series at any rate, but 30 frames per second is the recommended speed. We try to create our time series so that they look smooth and animate well at 30 fps. The frame rate is sometimes limited based on the time resolution of the data and the type of data. It is important to keep this in mind when creating a time series so that you make enough images to ensure that the dataset plays for a reasonable length. If you only make 30 images, then it will only take one second to loop through the dataset at 30 frames per second. The optimal playback speed is chosen based on the number of frames and the degree of change between each frame in the sequence. To get smooth time series, the changes between each frame should be small and the playback speed high. If a time series is coarse, then it might animate better at a slower frame rate such as 10–15 fps.
File Names
Permalink to File NamesSingle images are typically named for their resolution, such as “4096.jpg”. Image sequences are kept in folders that are named for their resolution, and the images themselves should be named to sort in ascending order from earliest to latest. This can either be done with a time stamp in the file name, or a frame number in the file name with a sufficient number of leading zeros in ensure proper sorting, shown in the example below. Videos should be named based on content and resolution, such as hurricanes_2048.mp4. By including the resolution in the file names, SOS users are able to easily determine what is available and appropriate for their system. The SOS software does not handle spaces and special characters in file names well. Do not use spaces and special characters in file names!
snow_ice_2048_20110730.png
snow_ice_2048_20110731.png
snow_ice_2048_20110801.png
snow_ice_2048_20110802.pngsos_jpl_4096.0001.jpg
sos_jpl_4096.0002.jpg
sos_jpl_4096.0003.jpg
sos_jpl_4096.0004.jpgExamples of files named by date or using an ordinal number.
Labels & Colorbars
Permalink to Labels & ColorbarsLabels and colorbars are important for providing context. Labels and color bars can be in the frames or projected on top of them externally. It is recommended that you do not add the labels and color bars directly to the frames that you create. By keeping them as external images, you have much more flexibility with their size and position within the playlist.sos file. If you do choose to put your labels and colorbars directly on the images that you create (we call this burning them in), make sure that you make them big enough so that they are legible on the sphere and that they are far enough from the poles that they don’t get too warped.
One of the nice things about keeping the labels and color bars external is that they don’t move as you rotate a dataset. They stay in the same position relative to the projectors. Labels and color bars that are part of the frame rotate with the frame, which can cause viewing trouble for the audience as you move the sphere about.
SOS version 5.3 and after: Use the SOS Visual Playlist Editor to set the label position to a non default value, and use the Label Editor to fully customize the format (color, font, etc) of label text.
SOS version 5.2 and before: Within the playlist.sos file you can set the
position using the labelposition attribute, which is set by the x and y
position as a pair of coordinates (x,y). Both x and y can vary from -1 to 1.
The default position is (-0.3, -0.5). The label color can be changed with the
labelColor attribute which can be set to R, G, B, Alpha, (or the symbolic
names: white, black, red, green, blue, …). The default color for the labels is
white. While you can change the position and color, you cannot change the size
or font.
For every dataset that needs a timestamp, a simple text file called labels.txt
should be generated that contains one line for each frame in the animation. A
labels.txt file cannot be used with a single image. If you have labels for a
times series that contains 2000 frames, then you need a text file that has 2000
lines. In the playlist.sos file, if label = default is included, then the
image file names appear as the labels on the sphere. The labels file should be
stored in the dataset folder and is typically named labels.txt. The labels
usually contain the date and maybe a title.
07/24/2004 07:30
07/24/2004 07:45
07/24/2004 08:00
SSEC 08/31/2005 Katrina
SSEC 08/31/2005 Katrina Maria
SSEC 09/01/2005 Maria
Examples of labels files. The first example labels each frame with the date and time. The second example labels each frame with the date and the name of the hurricane currently visible in the frame.
If you don’t want to include the title in your labels file, then you can make an image of title that you can include as a Picture in a Picture. This allows you to choose the font and color scheme of your choosing when you make the title image. This is also a nice option because then you don’t need to insert the title into every line of your labels file.

An example of a title that was turned into an image for a PIP.
Alternatively, you can directly create a title—or any text in general—on SOS by using a Text PIP. In addition to using the labels.txt file, there are other ways of labeling the content that is on the sphere. Colorbars and legends can be added using the Picture in a Picture feature. As with the timestamps, do not “burn in” colorbars and legends. Make sure to test the size and fonts of colorbars and legends on the sphere to ensure legibility. Most colorbars and legends are generally too small when originally displayed on SOS and have to be increased in size. Also, make sure to test the size to ensure that the colorbars aren’t so large that they hinder the audience from seeing the underlying dataset.
The purpose of adding labels to the sphere is to aid the visitor in understanding the dataset. Consider using pictographs for scales because they have been found to be intuitive and beneficial for visitor understanding. Also, using country or city labels can help visitors orient themselves in a global context. Another suggestion is to use vertical temperature colorbars because that is how most visitors are accustomed to reading thermometers. Size, orientation and placement of colorbars and legends are important for improving the visitor’s understanding of the dataset.
There is a lot of flexibility with the color bars. They are inserted into the playlist.sos file as a pip. Using this function, you can not only set the position, size and transparency, but also when the color bar appears, how long it stays visible, and how quickly it fades in and out. The color bars can be any common image format such as GIF, JPEG, PNG, TIF, etc. Color bars are generally named color_bar in order to keep all of the various images in the file separate.
Captions
Permalink to CaptionsCaptions can be displayed on SOS from standard SupRip Subtitle (SRT) files that are read in to SOS directly. An SRT file is an industry standard file that contains a sequential set of subtitles with their start and end timecodes. Captions provide text for hard of hearing (the left image below) or non-English speaking audiences (the right image below) and can also be used to show movies in AutoRun with the sound muted. Text formatting may also be fully customized in the SOS Visual Playlist Editor. NOAA datasets will be getting closed captions added to them for your use, but will not be shown by default. The captions may then be turned on in the Remote App or displayed all the time by setting the visibility in your presentations.
For SOS, the block of text associated with each sequence number in the .srt file can be written in one or more lines, however the total character count of all lines should not exceed 50-53 characters.
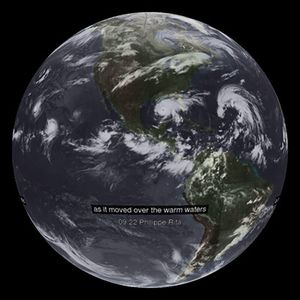
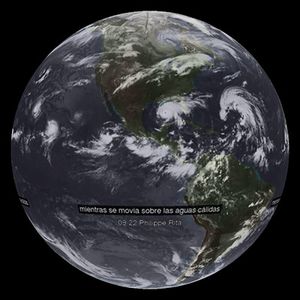
Examples of captions from the Hurricane Rita dataset. The first example is captioned in English, the second is captioned in Spanish.