Meteorologists use many tools to predict the weather. They use past data such as temperature observations, real-time data such as radar and satellite images, and models that look into the future. Many different parameters are plotted using the numerical forecast models, which are generated using computers. The models consist of numerical equations which use current conditions as the inputs. The resulting outputs are forecasts for what is likely to happen in the future, based on those initial conditions. There are many different models that all attempt to do the same thing. The Global Forecast System model is used in this visualization.
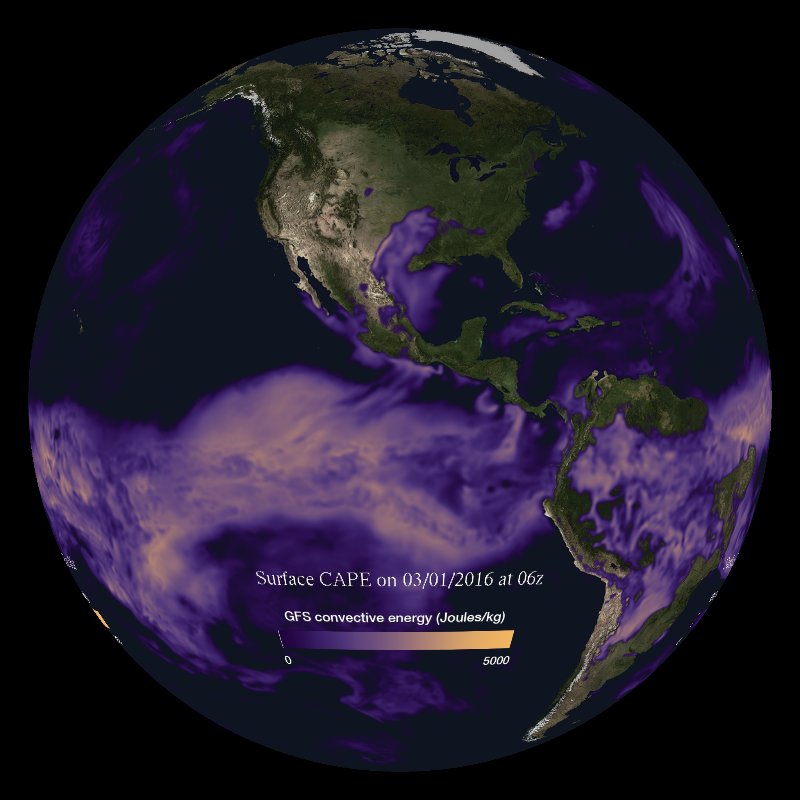
Severe weather, such as thunderstorms, form as a result of convection - when heat or moisture rise in the atmosphere. The energy of these rising air masses can be measured as the Convective Available Potential Energy, or CAPE. In other words, the greater amount of storm-forming convection, the higher the CAPE value. This imagery shows the predicted CAPE from the NOAA Global Forecast System weather model, which updates every six hours and provides weather predictions for 10 days (240 hours) out from the start time, in three-hour time increments. This data is useful for seeing, well in advance, areas where severe weather might arise, including thunderstorms, hail, tornadoes and even cyclones. Topical areas, due to the high temperatures and moisture of the surface air masses, tend to have the highest CAPE values, though high CAPE can be seen to seemingly flow into the mid-latitudes.