Meteorologists use many tools to predict the weather. They use past data such as temperature observations, real-time data such as radar and satellite images, and models that look into the future. Many different parameters are plotted using the numerical forecast models, which are generated using computers. The models consist of numerical equations which use current conditions as the inputs. The resulting outputs are forecasts for what is likely to happen in the future, based on those initial conditions. There are many different models that all attempt to do the same thing. The Global Forecast System model is used in this visualization.
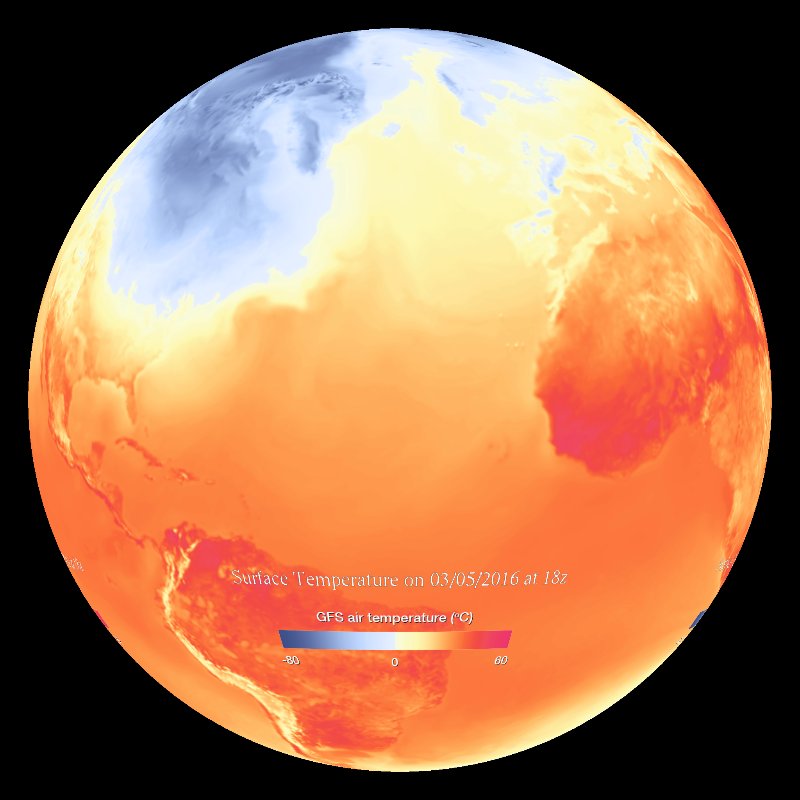
Temperature across the planet has great variation in time and space. This imagery shows the predicted air temperature (at 2 meters). Pink and orange areas are hot; yellow areas are mild; and a distinct transition to blue occurs at the freezing point (32°F or 0°C). During the winter especially, cold fronts can be seen to move into the U.S. and Europe from the northern latitudes; during the summer, many areas are seen to dramatically increase in daytime temperature—part of the diurnal cycle of heating and cooling that occurs over the planet. This imagery is an output of the NOAA Global Forecast System weather model, which updates every six hours and provides weather predictions for 10 days (240 hours) out from the start time, in three-hour time increments.