This video gives an overview of atmospheric carbon dioxide levels since the Mauna Loa record began in 1958. The time series has natural increases and decreases due to the seasonal cycle with a long-term trend toward rising levels of CO2 in the atmosphere. The natural seasonal cycle is explained using satellite imagery of vegetation on land and in the ocean: when more terrestrial plants are growing during Northern Hemisphere spring and summer, they use carbon dioxide in photosynthesis and atmospheric CO2 levels decrease. During winter when Northern Hemisphere terrestrial plants are dormant, they stop using CO2 and release some of it back to the atmosphere causing increased CO2 in the atmosphere. Satellite imagery of atmospheric CO2 since 2002 shows the long-term increase. The Mauna Loa CO2 record first reached 400ppm in May, 2013 and has been increasingly above 400ppm since then.
As plants turn green and grow during spring and summer, they use carbon dioxide in photosynthesis and remove it from the air. When plants go dormant in winter, atmospheric carbon dioxide levels rise.
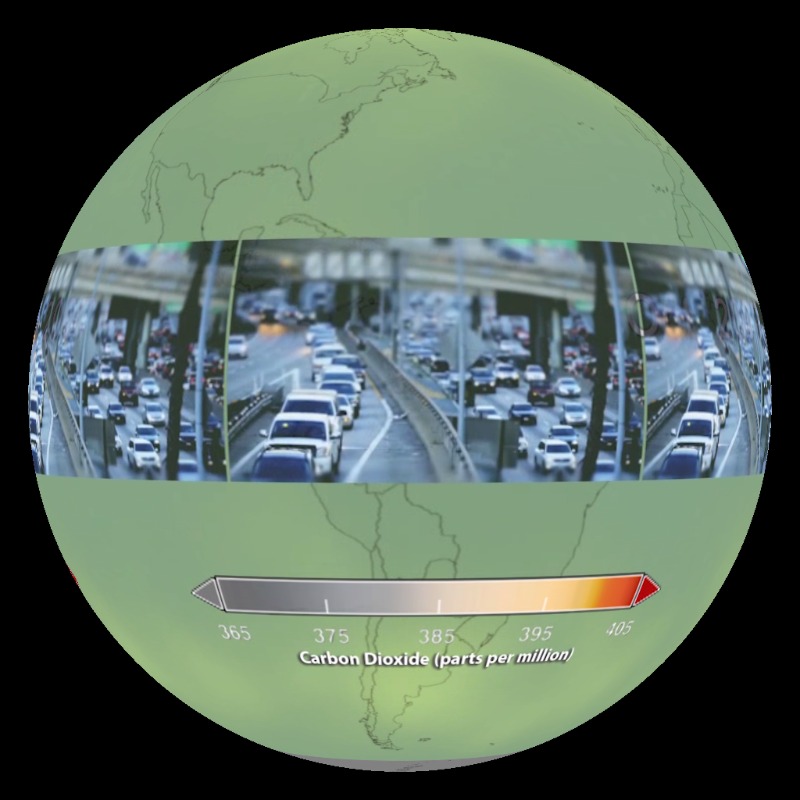
More carbon dioxide is released by humans in the Northern Hemisphere through our energy consumption, transportation and food production. In the Southern Hemisphere, biomass burning and clearing old growth forests lead to increased atmospheric CO2.
No matter where it comes from, once carbon dioxide is in the air it spreads out around the world and has an extremely long residence time in the atmosphere.