Using Tour Builder to Add New Datasets
Video tutorials are also available in the Video Tutorials.
Dataset Editor Window
Permalink to Dataset Editor Window- Open Tour Builder
- Select MenuToolsDataset Editor
- Select a directory for your new dataset (it needs to exist in local-datasets to show up in SOSx)
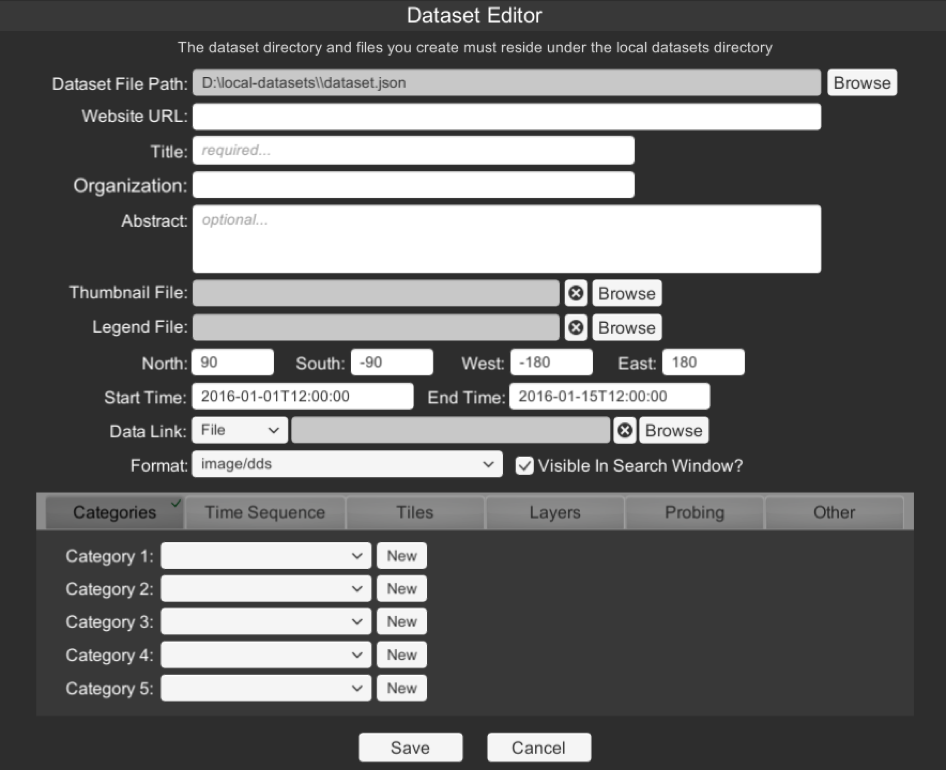
- Enter all of the information “required” in the window shown below
- North/South/East/West can be used as a bounding box for an image that is not global
- Data Link points to a file (image or video) or a directory of images
Categories
Permalink to CategoriesBrowsing dropdown in the Search Window display categories. Your system comes with Air, Experiences, Extras, Land, Movies, People, Snow and Ice, Space, Tours, Water. Add new categories as desired. Add as many categories as is appropriate for your dataset.
The Dataset Editor with the Categories tab selected
Time Sequence
Permalink to Time SequenceFor an image sequence (directory of images), you must enter the Period, Filename Mask and for frame counts, also add File Seq Start (file sequence start) and File Seq Increment (file sequence end). See [Establishing Time Sequences for Images][establishing-time] for more information.
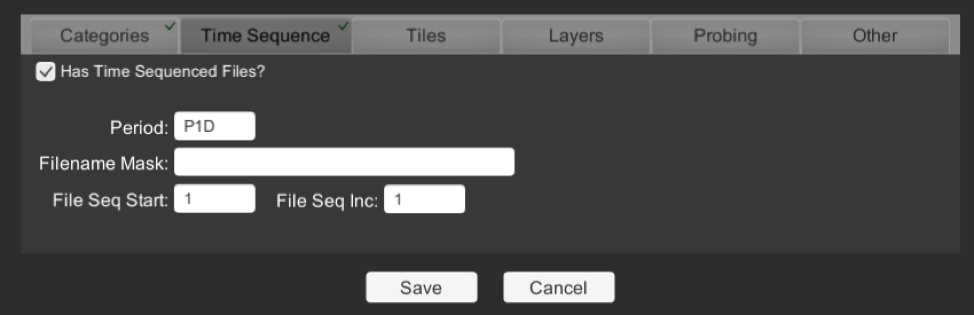
Time Sequence tab in the Dataset Editor
Layers
Permalink to LayersGive the layer a Title. DataLink is the name of the file, i.e. map.jpg. Choose Format. Save. You may add many layers.
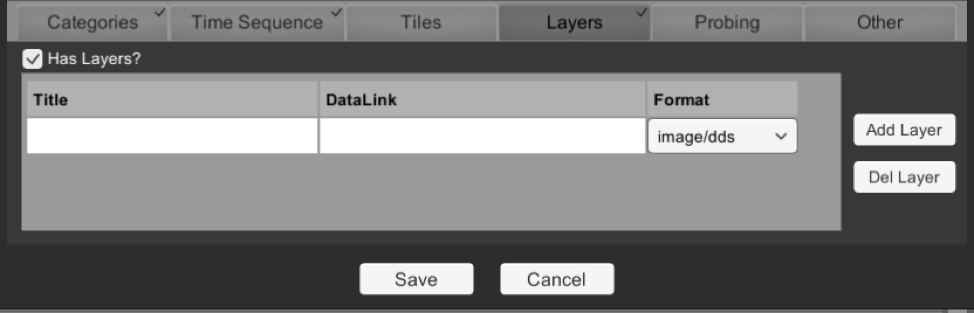
Layers tab in the Dataset Editor
Probing
Permalink to ProbingIf your colorbar.png is a linear, continuous gradient and your data is full color than you may want to consider filling out the probing table.
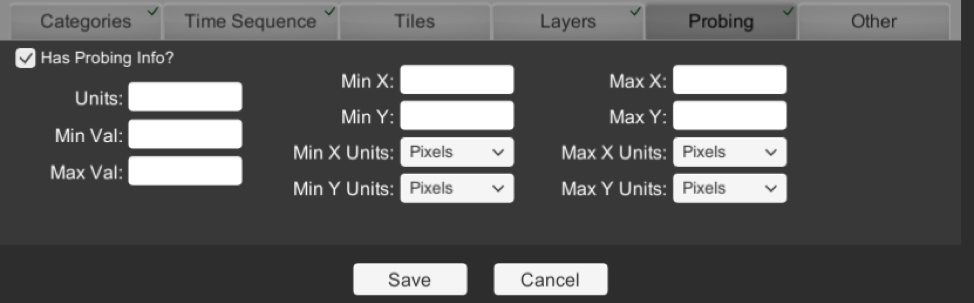
Probing tab in the Dataset Editor
Other
Permalink to OtherIf your dataset is not Earth and is a “celestial body” then checking this box disables geographic overlays specific to Earth. KML Icon Scale Factor scales the size of icons. KML Override Icon allows you to browse to a .png file that will be used for your KML placemarks.
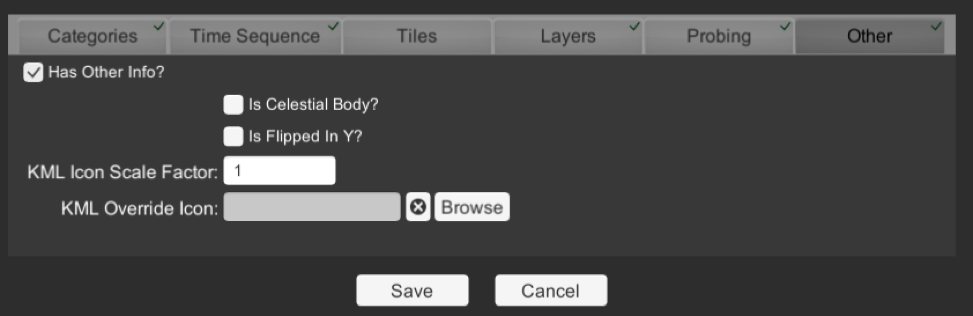
Other tab in the Dataset Editor
Tools Used to Create Images from Data
Permalink to Tools Used to Create Images from DataBecause SOSx uses basic image formats like JPEG, and PNG as its main input format, there are many tools available for creating datasets. Common examples are Photoshop®, ImageMagick®, GIMP, GIS, etc.
For creating MPEG4 files with transitions, special effects and narration, programs such as FinalCut Pro® and Adobe After Effects® are useful.
Tools like IDL, AWIPS, McIDAS, and other image analysis applications are typically used to create imagery from scientific data sets. GIS programs such as ArcGIS or Quantum GIS can be used to create map images.
Graphics designers can use a 3D modeling applications, like 3D Studio®, to create advanced visualizations.
GIS programs such as ArcGIS or Quantum GIS can be used to create map images. A tutorial for creating SOSx datasets with Quantum GIS is available here: QGIS Tutorial.
More Information on Visualization Considerations
Permalink to More Information on Visualization ConsiderationsThe following article, researching the public understanding of science content, was written by SOS Users Collaborative Network members: Phipps, M. and Rowe, S. (2010) Seeing satellite data Public Understanding of Science. doi:10.1177/0963662508098684.