New Content Formats and Considerations
Data Format
Permalink to Data FormatDataset Types
Permalink to Dataset TypesThere are three basic types of datasets for SOSx:
- Texture (Single Image)
- Time Series (Image Sequence)
- Video (MPEG4)
Texture (Single Image)
Permalink to Texture (Single Image)Can be displayed on the sphere. An example of this is a global image of the Age of the Seafloor. It’s a static image that can be manipulated and rotated in real time from the user interface or remote control.
Time Series (Image Sequence)
Permalink to Time Series (Image Sequence)Animates through time. An example of this would be a loop of satellite data. For an image sequence, SOSx will display the images in sequence and play them like a movie across the entire sphere surface at a pre-determined fps (frames per second). Image sequences can be of any arbitrary length, limited mainly by disk space and can be animated at frame rates up to 60 frames per second.
Video (MPEG4)
Permalink to Video (MPEG4)MPEG4’s save disk space but do not show time on SOSx. This means that we cannot display the date and time for data using an MP4. We suggest using Time Series for datasets where date and time are needed. Transitions, audio, special effects, and other computer graphics techniques can be added to a sequence through the use of off the shelf software like Final Cut Pro.
Unity Asset Bundles
Permalink to Unity Asset BundlesUnity Asset Bundles can also be made for SOSx and loaded in the application. Email sos.explorer@noaa.gov for more information. (1.4 examples: Saturn with Rings, Experience: Tornado Safety).
Map Projection
Permalink to Map ProjectionFor complete globe datasets
Permalink to For complete globe datasetsUse the equatorial cylindrical equidistant projection. This is a simple latitude/longitude grid with the lines evenly spaced where the image is twice as wide as it is tall. To be consistent with the SOS Data Catalog, it is recommended that the 0° line go through the middle of the map, with the +/-180° lines at the edges.
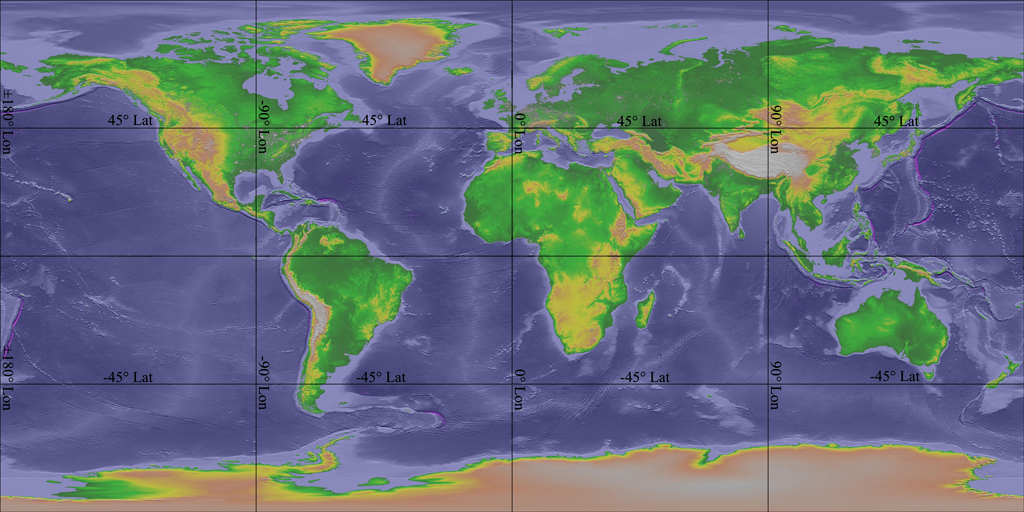
Equatorial cylindrical equidistant project
For partial globe datasets
Permalink to For partial globe datasetsA bounding box can be set for north, south, east, west to show only a part of the world. This works best if the data is .png format, as the blue marble base map will show up underneath.
Image Format
Permalink to Image FormatFor single images SOSx supports JPEG, PNG, or DDS.
For image sequences SOSx supports DDS only. The Tour Builder software application included in your installation can convert to DDS for an image directory.
Video Format
Permalink to Video FormatSOSx supports MPEG4, OGV, WMV videos. Render the video with the MPEG4 video codec at a minimum of 25 mbps.
Alternative Formats
Permalink to Alternative FormatsThe software also has the ability to display KML (Keyhole Markup Language) and the compressed KMZ files on SOSx. KML is a popular specification and actively used with Google Earth for displaying data on a sphere.
Resolution
Permalink to Resolution4096×2048 for animations, 8192×4096 for single images (textures).
Those are the recommended resolutions, though other 2x1 resolutions, such as 3000x1500 will work. We recommend a minimum of 2K for any dataset. Datasets with very high resolution and progressive disclosure tiles can also be added. Email sos.explorer@noaa.gov for more information.
Audio Format
Permalink to Audio FormatSOSx supports MP3, MPEG4, WAV, OGG, AIF…
If the audio file is standalone as a narration for a tour, you can use the above formats. If it is used for a movie, it should be embedded in the same MPEG4 file as the video.
Image Considerations
Permalink to Image ConsiderationsSeams
Permalink to SeamsThe data should take up the whole image, with no borders or extra space around the edges. Even a pixel border will show up as a seam! In most cases, a simple 1% stretch in the horizontal will fix the problem. The data should match up at the edges of the image. If it doesn’t, a seam will appear where the mismatch happens and it won’t look seamless on the sphere. Examples of seams problems are shown below.
In addition to making sure that the data fills the entire frame, from 180° West to 180° East, also make sure that the data fills the entire frame from 90° South to 90° North. If there is missing data at the poles, fill in the area with a solid color or a basic land/ocean background to ensure that the dataset wraps properly around the sphere without stretching vertically.
Examples of seams. The first image shows a seam caused by a border around the image. The second image is a discontinuity caused by the fact that the left edge of the visualization does not match the right.
Layers
Permalink to LayersThe layering capability in SOSx allows presenters to dynamically turn layers on and off, adding flexibility to the dataset.
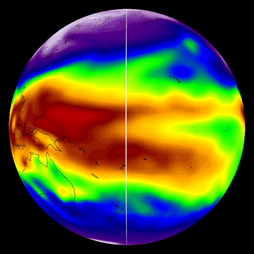
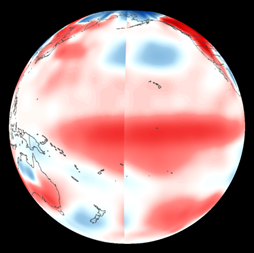
An example of using semi-transparent layers to combine two datasets
Color Suggestions
Permalink to Color SuggestionsA color scale can dramatically change the emphasis and message of a dataset. Because of this, the Science On a Sphere Users Collaborative Network has had many discussions on the color scales that are used for SOSx datasets. The goal is to create datasets with well-chosen color scales that are meaningful, intuitive, and scientifically accurate. Several conclusions are the result of these discussions:
- It can be confusing to users when the same color scheme and their associated color bars are used for two completely unrelated datasets
- The same color should not be used to represent more than one thing, i.e. if ice is shaded white, then white should not also be used for areas of missing data
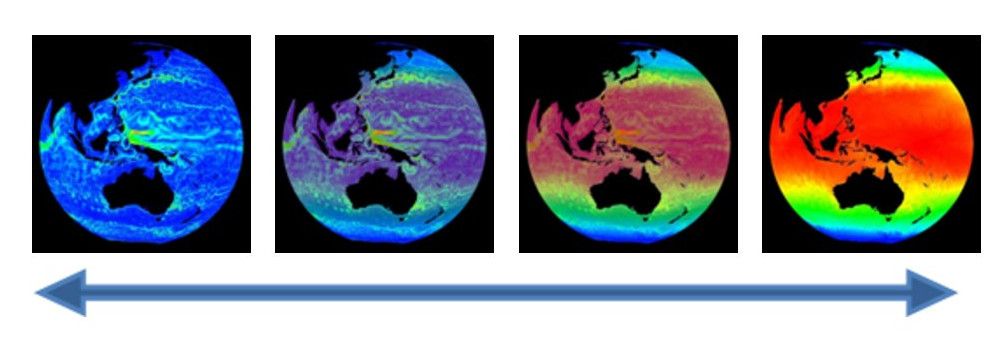
- Using rainbow-colored legends and color schemes is often confusing to the audience and hard to parse. Instead, consider using shades of green to represent phytoplankton, and blue and red gradations to represent temperature anomalies, i.e. use “meaningful” colors
- Avoid using full sphere backgrounds that are completely or pre-dominantly white. The seams between projectors become more apparent when using solid white/bright backgrounds. If using bright background colors, consider adding some noise/texture to them. Same goes for PIPs, especially those displayed at the seams between projectors
Preparing Your Content
Permalink to Preparing Your ContentFile Names
Permalink to File NamesSingle images are typically named for their resolution, such as 4096.jpg.
Image sequences are kept in folders that are named for their resolution, and the images themselves should be named to sort in ascending order from earliest to latest. This can either be done with a time stamp in the file name, or a frame number in the file name with a sufficient number of leading zeros to ensure time compatibility, shown in the examples below. If your data is time-matched, the images should be named accordingly. See Filename Mask examples in Establishing Time for Image Sequences below.
snow_ice_2048_20110730.png
snow_ice_2048_20110731.png
snow_ice_2048-20110801.png
Examples of files named by date
sos_jpl_4096.0001.jpg
sos_jpl_4096.0002.jpg
sos_jpl_4096.0003.jpg
Examples of files named by frame number
Videos should be named based on content and resolution, such as hurricanes_2048.mp4. Do not use spaces and special characters in file names.
Establishing Time for Image Sequences
Permalink to Establishing Time for Image SequencesIn order for SOSx to display time and date for your image sequence dataset, you need to be able to establish a Period, Start & End Time and a Filename Mask. These are added in the Tour Builder when adding a new dataset. This is also dependent on an indicative filename sequence.
Period
Permalink to PeriodPeriods in SOSx are coded using ISO 8601. For example: If you have an image for every day, you would enter: P1D. If you have an image for every 15 minutes, you would enter: PT15M.
Start & End Time
Permalink to Start & End TimeStart & End Time are entered as year, month, day and hour. For example: If your images run for all of 2015 (and are daily) you would enter
- Start time: 2015-01-01T00:00:00
- End Time: 2015-12-31T00:00:00
Filename Mask
Permalink to Filename MaskFilename Mask allows SOSx to understand, according to the Period and Start End Time, what is changing for each image in the sequence. The changing integers are marked with brackets [ ].
Using the example from above, named by date, your Filename Mask would be: Snow_ice_2048_[yyyyMMdd].png (When applicable, hours 0-23 are “HH”, minutes 0-59 are “mm”).
Using the example from above, named by frame number, your Filename Mask would be sos_jpl_4096.[####].jpg
In this “named by frame number” example, you would also enter File Sequence Start and File Sequence Increment: File Sequence Start is 1 and File Sequence Increment is 1. See Time Sequence in the Using Tour Builder section for the interface in Tour Builder where these are entered.
Colorbars and Legends
Permalink to Colorbars and LegendsColorbars and legends can (and should) be used when applicable as they provide context and units for the data. These should be standalone image files (.png or .jpg) and not burned into the global images. 500 pixels is our standard size. Never burn images into the data itself as warping can happen when wrapping around a sphere.
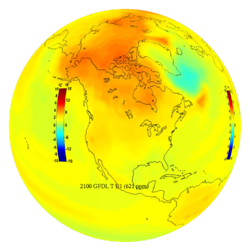
An example of a colorbar