Paper Globe Cutouts
A spherical projection is the best way to view Earth data, simply because Earth is a sphere! When you attempt to make a map of the world flat, certain locations become distorted, appearing bigger or smaller than they actually are. This hands-on activity allows you to explore the idea of Earth data and the difficulty associated with flat maps, and to enjoy the process of making a little globe. Two different sizes of Science On a Sphere’s most popular and important datasets are available for printing. We suggest using plain paper for printing and constructing, not heavy or cardstock paper.

Sample paper globe cutout.
Hurricane Tracks: Cumulative - 1950 - 2020
Permalink to Hurricane Tracks: Cumulative - 1950 - 2020This cutout globe shows the paths of significant storms from 1950 through 2020. Each line represents a tropical depression or tropical storm (blue or cyan) or a hurricane (yellow to red). Not all the storms follow the same path, but there are noticeable trends. The maximum sustained wind speeds are shown in the legend. Tracking historical storms is an important way for researchers to help forecast future events. Hurricane Tracks: Cumulative - 1950 - 2020 dataset.
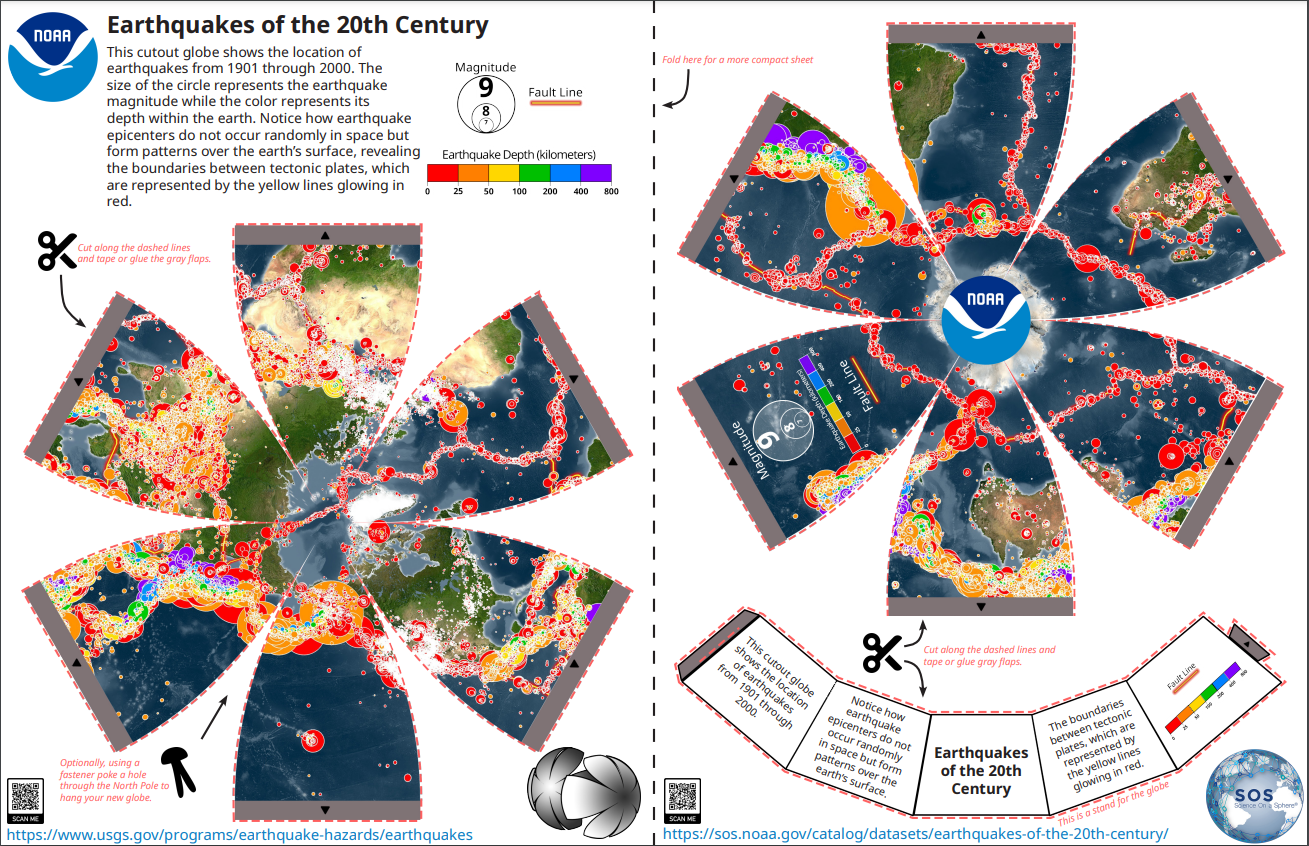
Earthquakes of the 20th Century
Permalink to Earthquakes of the 20th CenturyThis cutout globe shows the location of earthquakes from 1901 through 2000. The size of the circle represents the earthquake magnitude while the color represents its depth within the earth. Notice how earthquake epicenters do not occur randomly in space but form patterns over the earth’s surface, revealing the boundaries between tectonic plates, which are represented by the orange glowing lines. Earthquakes of the 20th Century dataset.
La Niña - Sea Surface Temperature Anomaly
Permalink to La Niña - Sea Surface Temperature AnomalySea surface temperature anomaly is the difference between the current temperature and the long-term temperature average. Negative temperature differences (blue) indicate that the ocean is cooler than average, while positive temperature differences (red) indicate that the ocean is warmer than average. Tracking sea surface anomalies helps scientists quickly identify areas of warming and cooling, which can affect coral reef ecosystems, hurricane development, and the development of El Niño and La Niña. This example shows a La Niña pattern. Sea Surface Temperature Anomaly - Real-Time dataset.
Surface Temperature Change in 2050 - SSP1 (Sustainability)
Permalink to Surface Temperature Change in 2050 - SSP1 (Sustainability)An international team has built a range of new “pathways” that examine how global society might change over the next century. They are collectively known as the “Shared Socioeconomic Pathways” (SSPs). NOAA has created several fully coupled climate and Earth system models that can use the SSPs to glimpse into the future. In this scenario, the world shifts gradually, but pervasively, toward a more sustainable path, emphasizing more inclusive development that respects perceived environmental boundaries. Surface Temperature Change: SSP1 (Sustainability) - 2015 - 2100 dataset.
Surface Temperature Change in 2050 - SSP5 (Fossil-fueled Development)
Permalink to Surface Temperature Change in 2050 - SSP5 (Fossil-fueled Development)An international team has built a range of new “pathways” that examine how global society might change over the next century. They are collectively known as the “Shared Socioeconomic Pathways” (SSPs). NOAA has created several fully coupled climate and Earth system models that can use the SSPs to glimpse into the future. In this scenario, the push for economic and social development is coupled with the exploitation of abundant fossil fuel resources and the adoption of resource- and energy-intensive lifestyles around the world. Surface Temperature Change: SSP5 (Fossil-fueled Development) - 2015 - 2100 dataset.
Sea Surface Salinity
Permalink to Sea Surface SalinityProcesses such as the weathering of rocks, evaporation of ocean water, and the formation of sea ice, have made the ocean salty. Those processes are counterbalanced by processes that decrease the salt in the ocean, like freshwater input from rivers, precipitation, and the melting of ice. The result is an ocean surface where the concentration of salt (salinity) changes and this has large-scale effects on Earth’s water cycle and ocean circulation. Sea Surface Salinity.
Resilient Community
Permalink to Resilient CommunityThis illustration from NOAA’s Environmental Literacy Program depicts several key aspects of the NOAA Community Resilience Education Theory of Change. This community represents a vision of the future where children, youth, and adults are learning together and are directly engaged in activities that improve the resilience of their community. Institutions, including museums, aquariums, schools, universities, companies, and centers of government, are also working to increase community resilience. Resilient Community.