Hurricane Tracks: Cumulative - 1950 - 2020
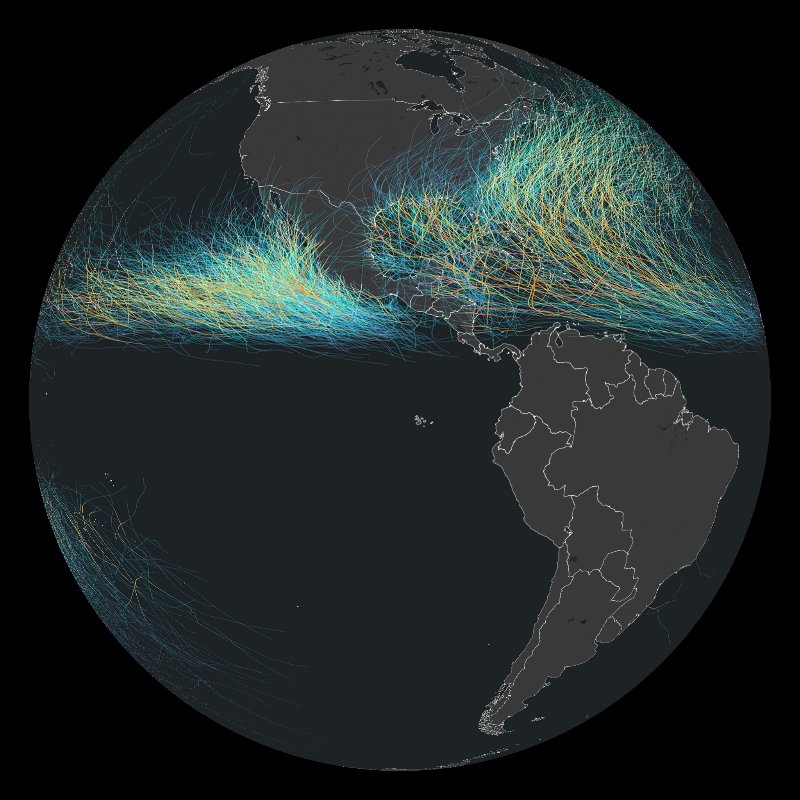
Hurricane Tracks shows global tropical cyclones from 1950 - 2020

Static hurricane tracks can spark surprising insights about our world. In this lesson, students will begin by slowly observing a hurricane-themed painting, then explore hurricane track data from 1950–2020, and finally expand their understanding of devastating disasters through the 2024 Billion-Dollar Weather and Climate Disasters map. Along the way, they’ll discuss hazards, population distribution, wind direction, and—most importantly—how to read colorbars.
What’s happening in this map? What do you notice that makes you think that?
In this short activity, students will strengthen their critical thinking skills by carefully observing the data, forming ideas, and backing them up with evidence.
While the main goal is to encourage slow, careful observation, this activity also connects to topics like weather, hazards, atmospheric general circulation. If you’re covering any of these, this could be a great addition to your unit!
Hurricane Tracks shows global tropical cyclones from 1950 - 2020