Hurricane Tracks: Cumulative - 1950 - 2020
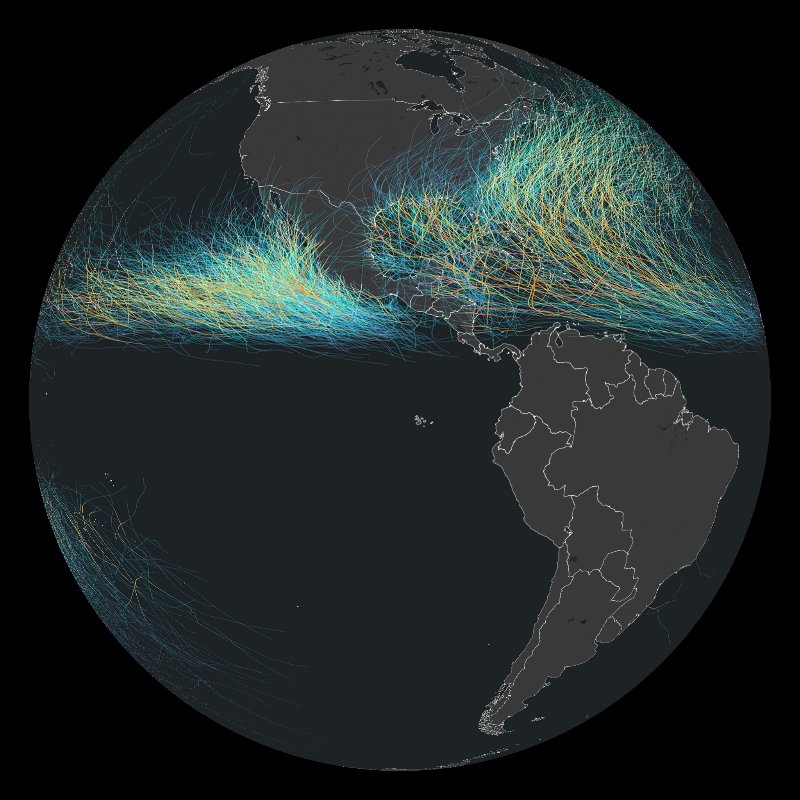
Hurricane tracks detail the areas most likely to be affected by tropical storms.
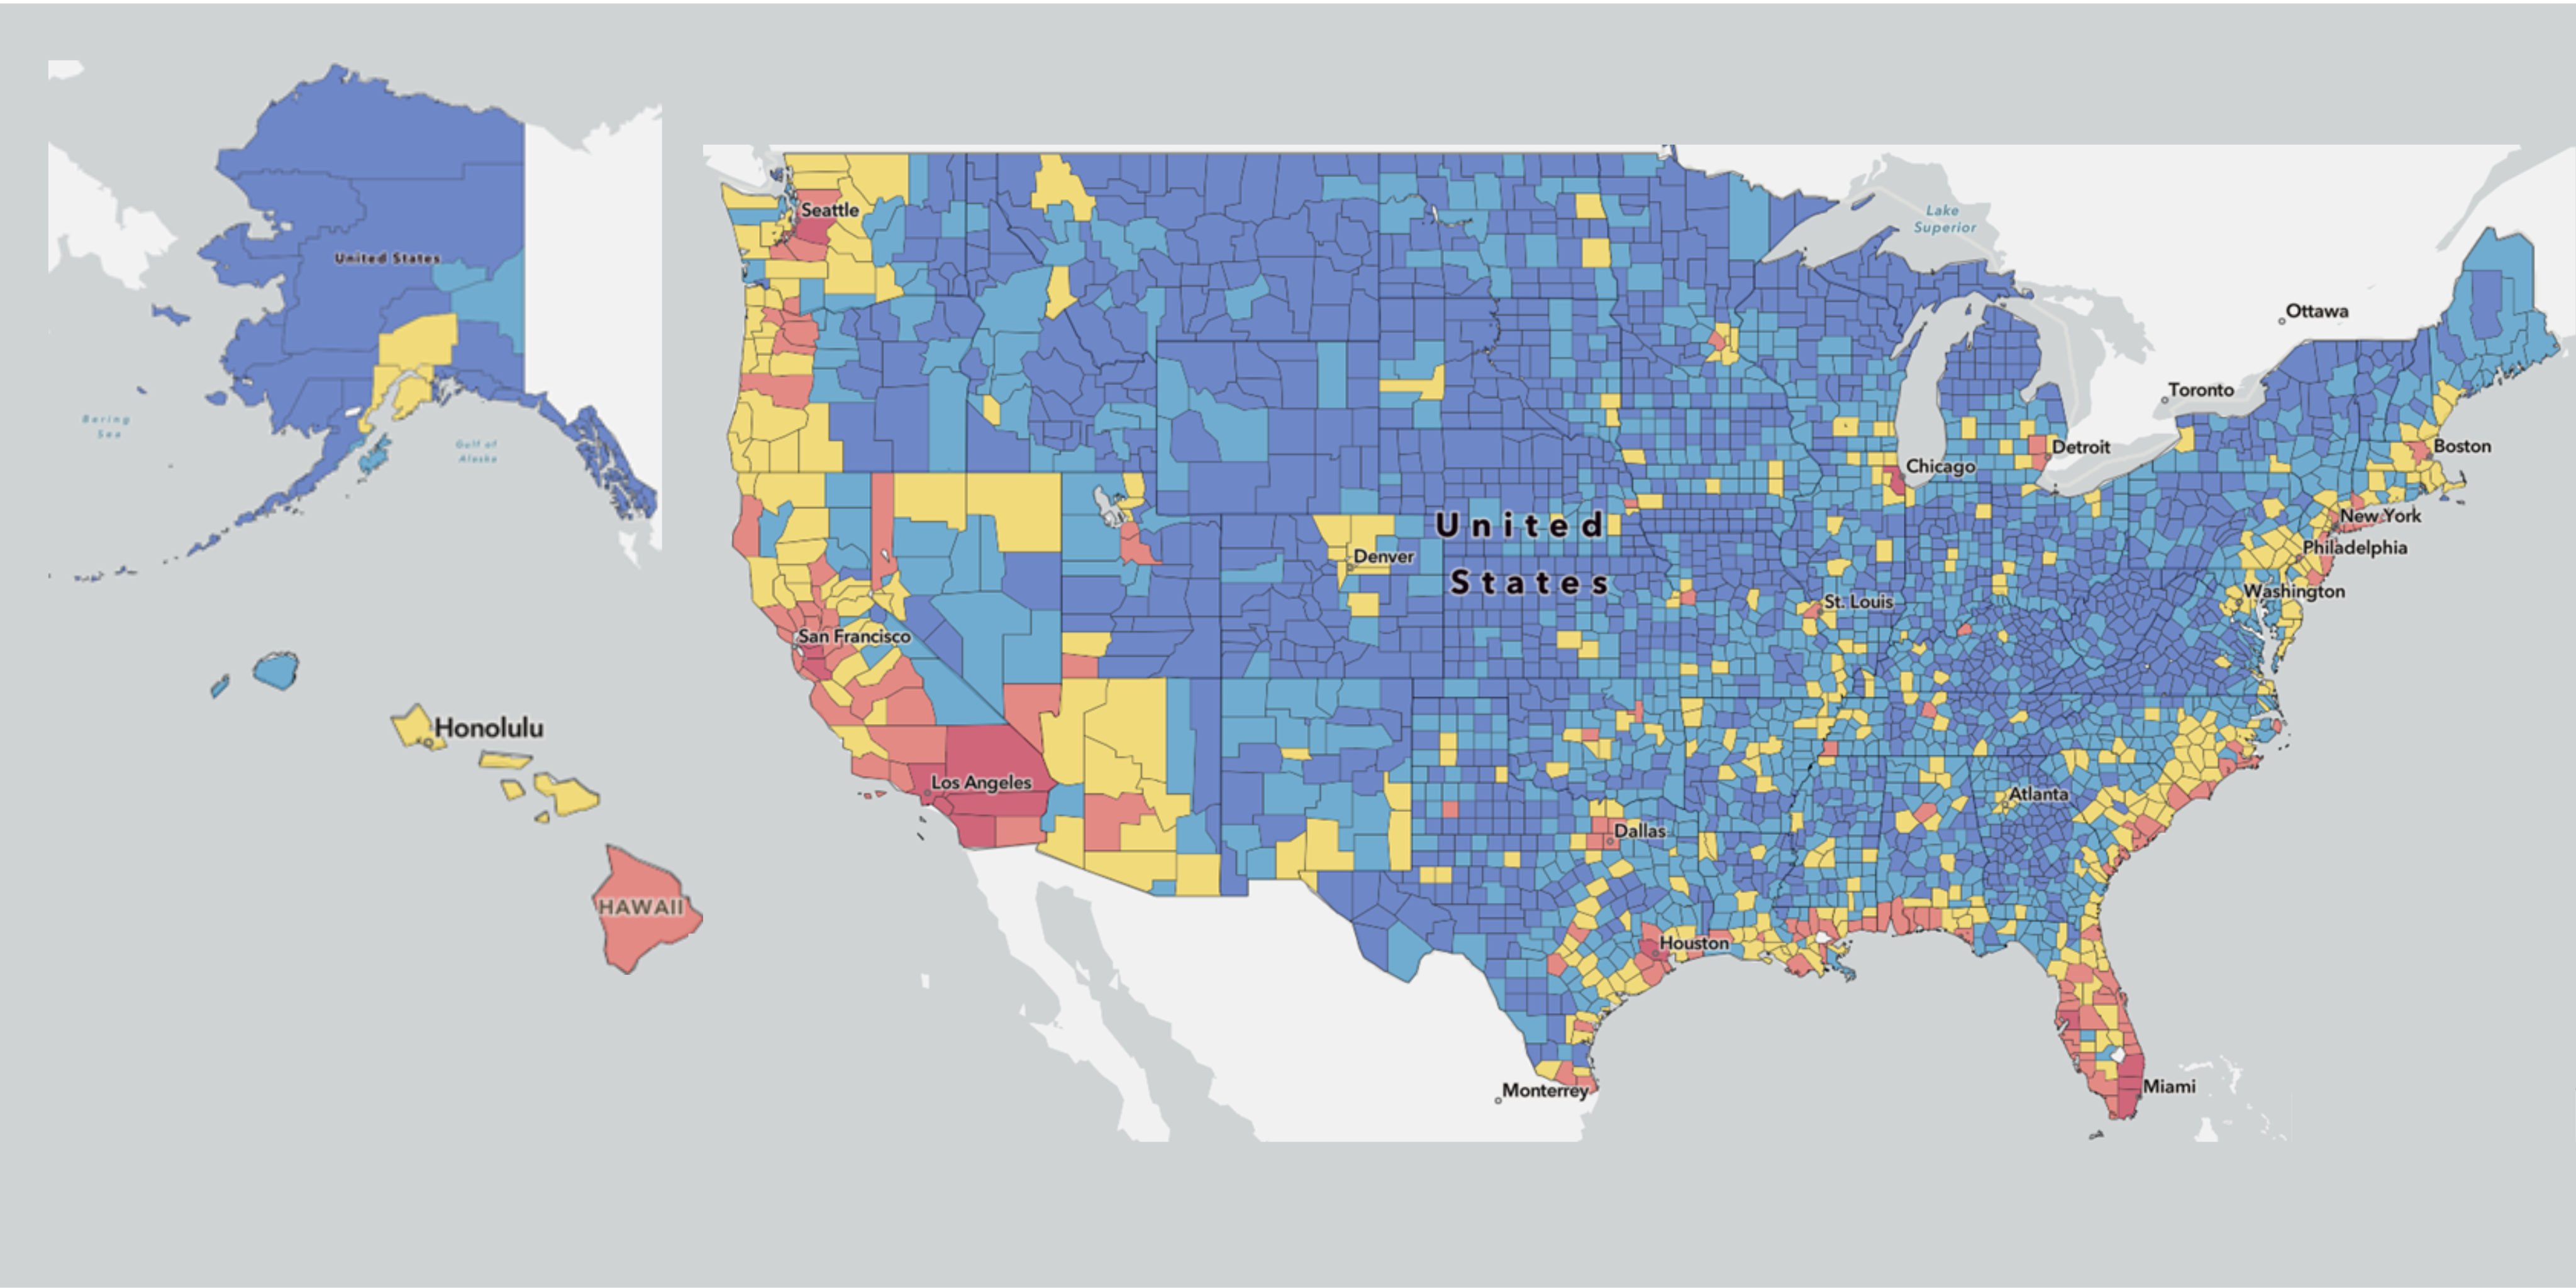
By exploring hazards in the National Risk Index interactive map, students find patterns of vulnerable areas, and through a deeper dive, get detailed information on their local risks compared to other counties in the U.S.
What’s happening in this map? What do you notice that makes you think that?
In this short activity, students will strengthen their critical thinking skills by carefully observing the data, forming ideas, and backing them up with evidence.
While these maps do relate to weather, climate, ice, and albedo the real goal of this activity is to help students slow down, look closely, ask better questions, and support their ideas with strong evidence. However, if you’re teaching a unit on local hazards, wildfire, flooding, or coastal vulnerability this could be a great addition to your lessons!
Hurricane tracks detail the areas most likely to be affected by tropical storms.