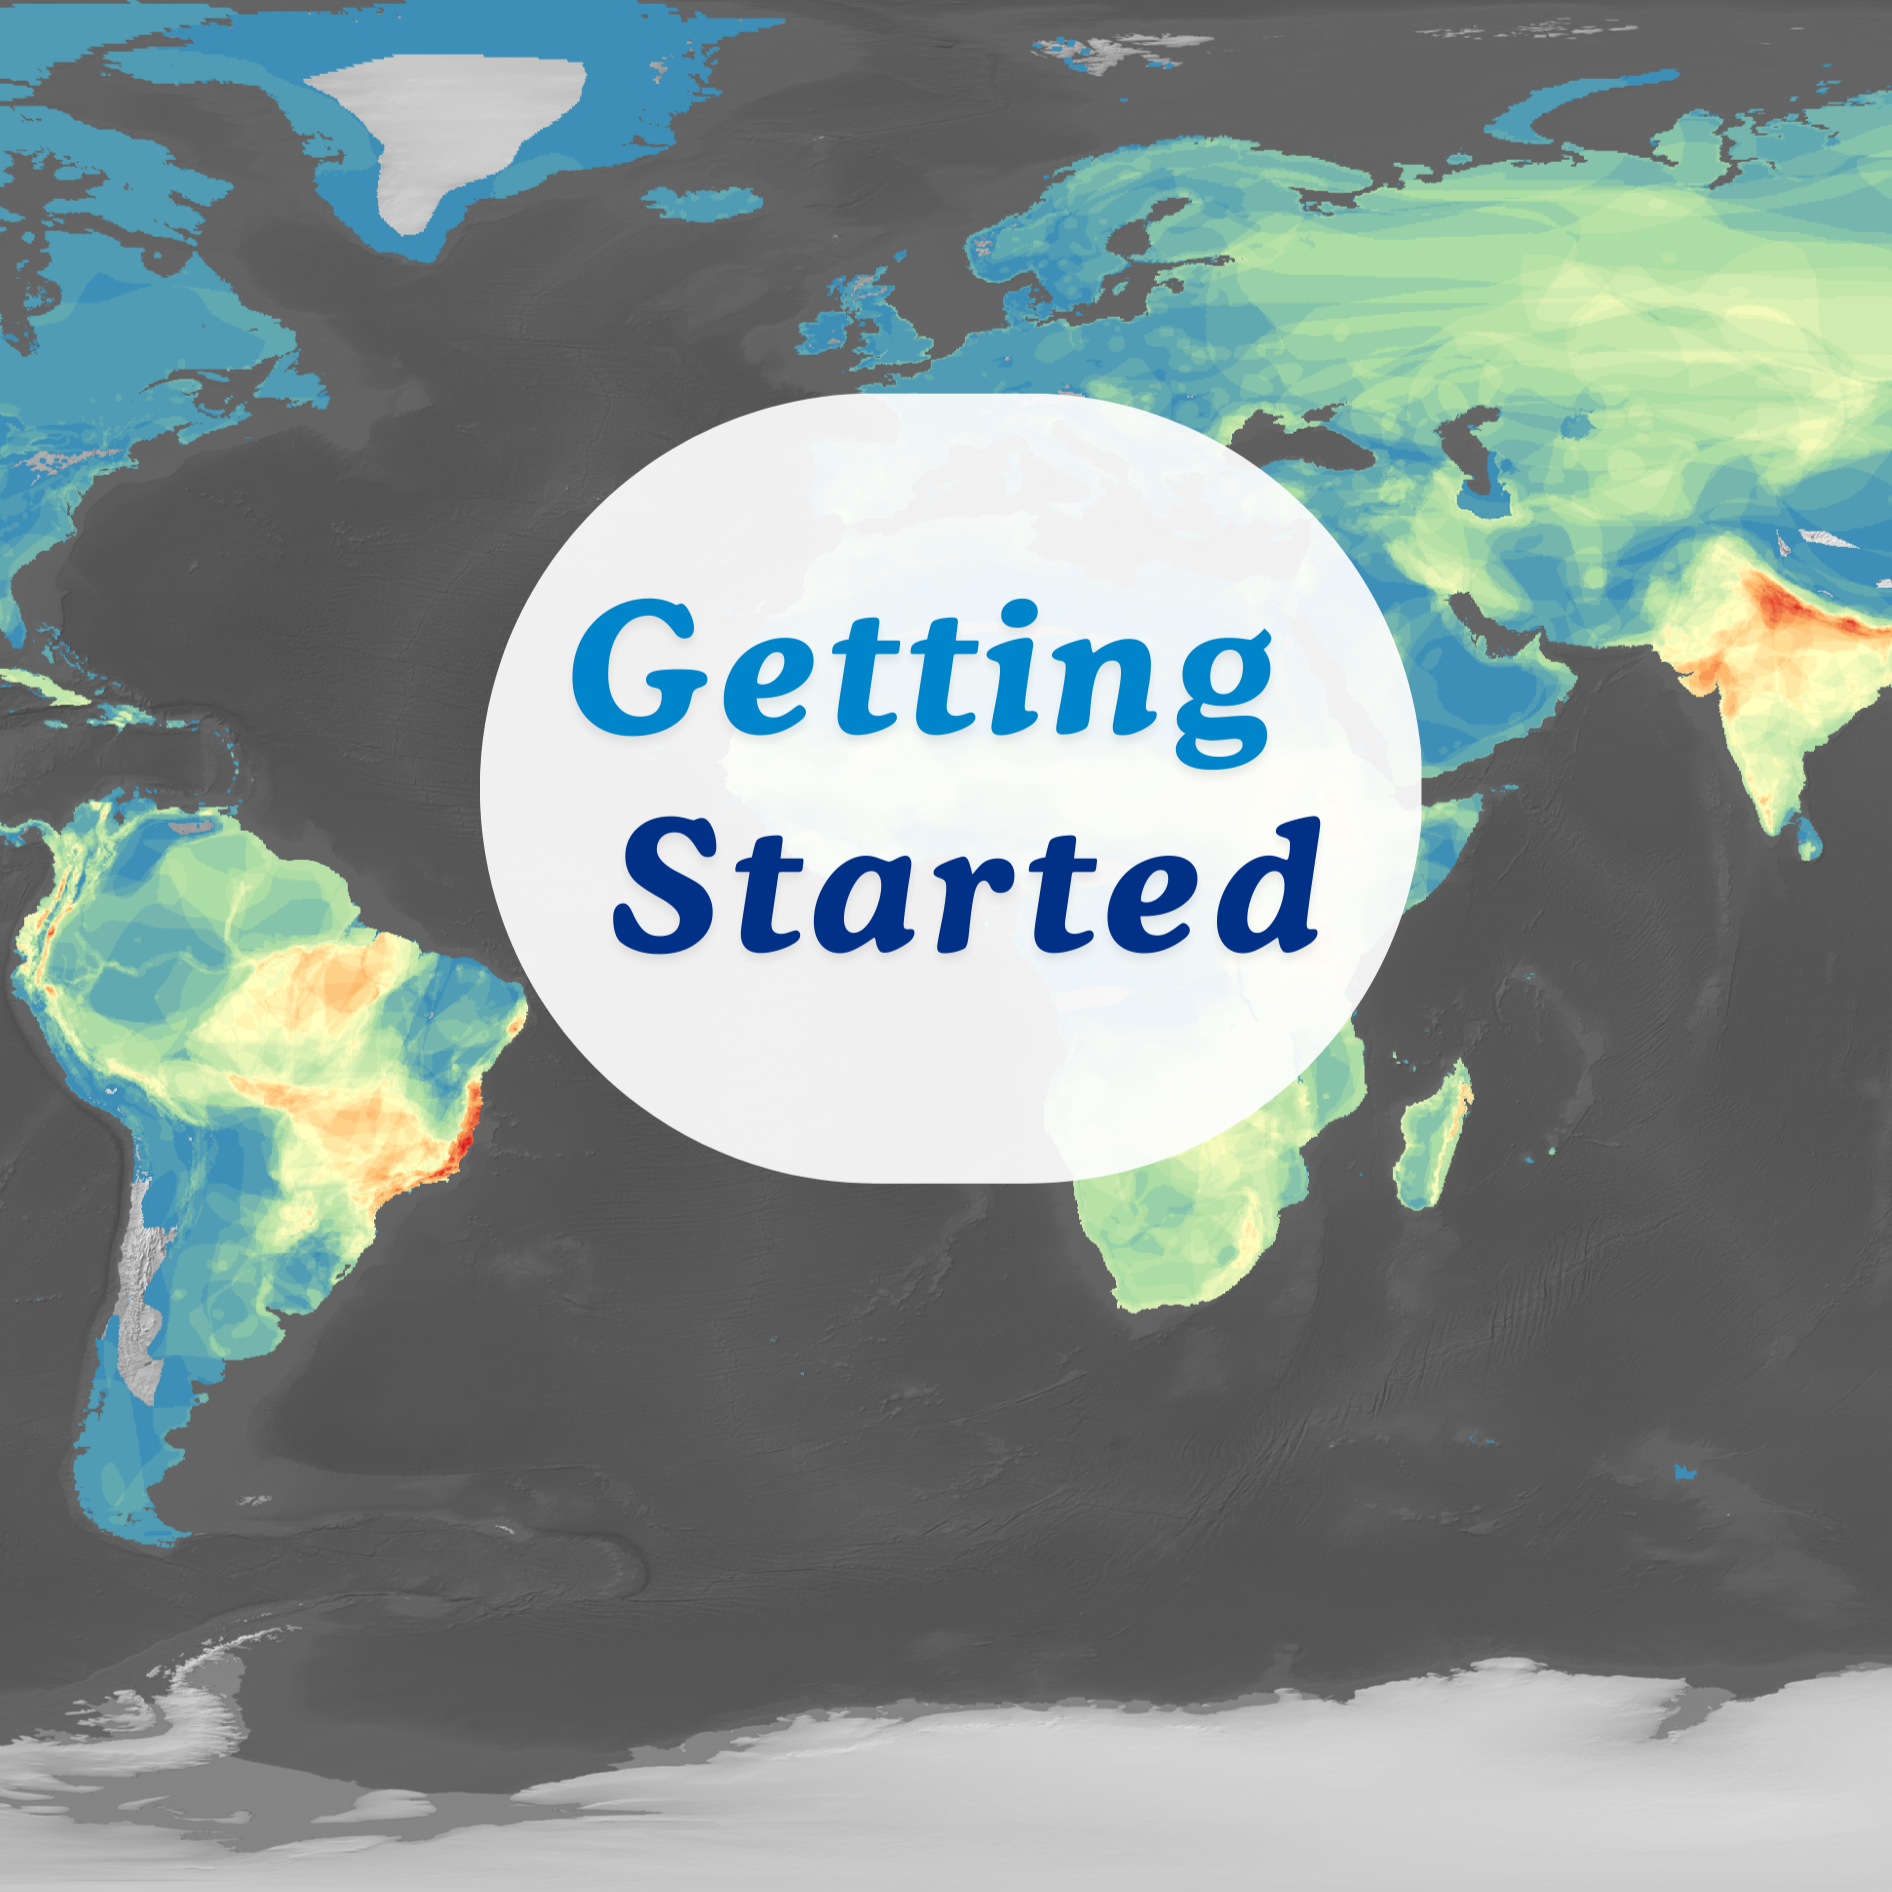
Getting Started with Data Lens
Data Lens are short, slow, and intentional observation-focused activities. Find the how and why to use them here.
Data Lens activities equip teachers with tools to help their students engage with and understand complex scientific data. Informed by Visual Thinking Strategies, each exercise includes a timely global map that can stand alone or open a discussion into a relevant classroom unit of study. When used regularly, these activities may help to increase data literacy skills in your classroom.
Sign up to receive Data Lens directly to your email inbox every few weeks! The activity remains fairly consistent week to week, making implementation easy!
View a recorded webinar demonstrating Data Lens and other visual and data literacy techniques.
See Getting Started below for more on how and why to use Data Lens in your classroom.
Data Lens are short, slow, and intentional observation-focused activities. Find the how and why to use them here.
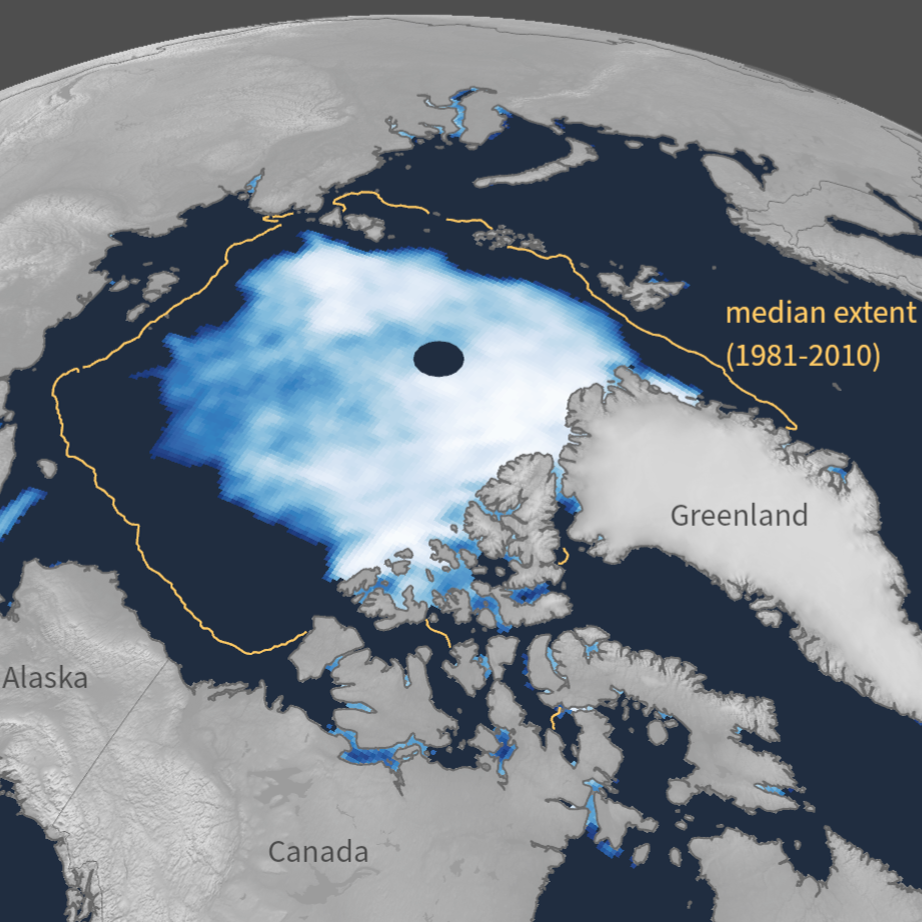
This week focuses on the changing cryosphere on our planet, both glacial melt and sea ice melt, and how that effects the climate system.

This week focuses on solar storms that occurred in November 2025 and the associated auroras.

This week focuses on carbon dioxide visuals that show different aspects of carbon dioxide emissions.

This week focuses on two different drought indicators - a global satellite dataset and the U.S. Drought Monitor created by the National Integrated Drought Information System.
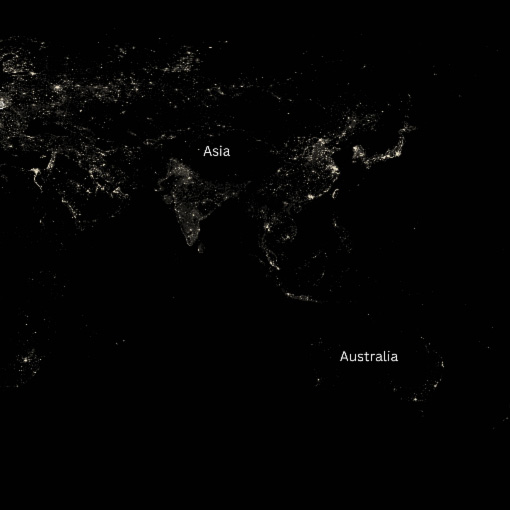
This week focuses on data collected of Earth at night and different ways to interpret changes in nighttime lights.

This activity focus on Hurricane Tracks and Billion-Dollar Weather and Climate Disasters.
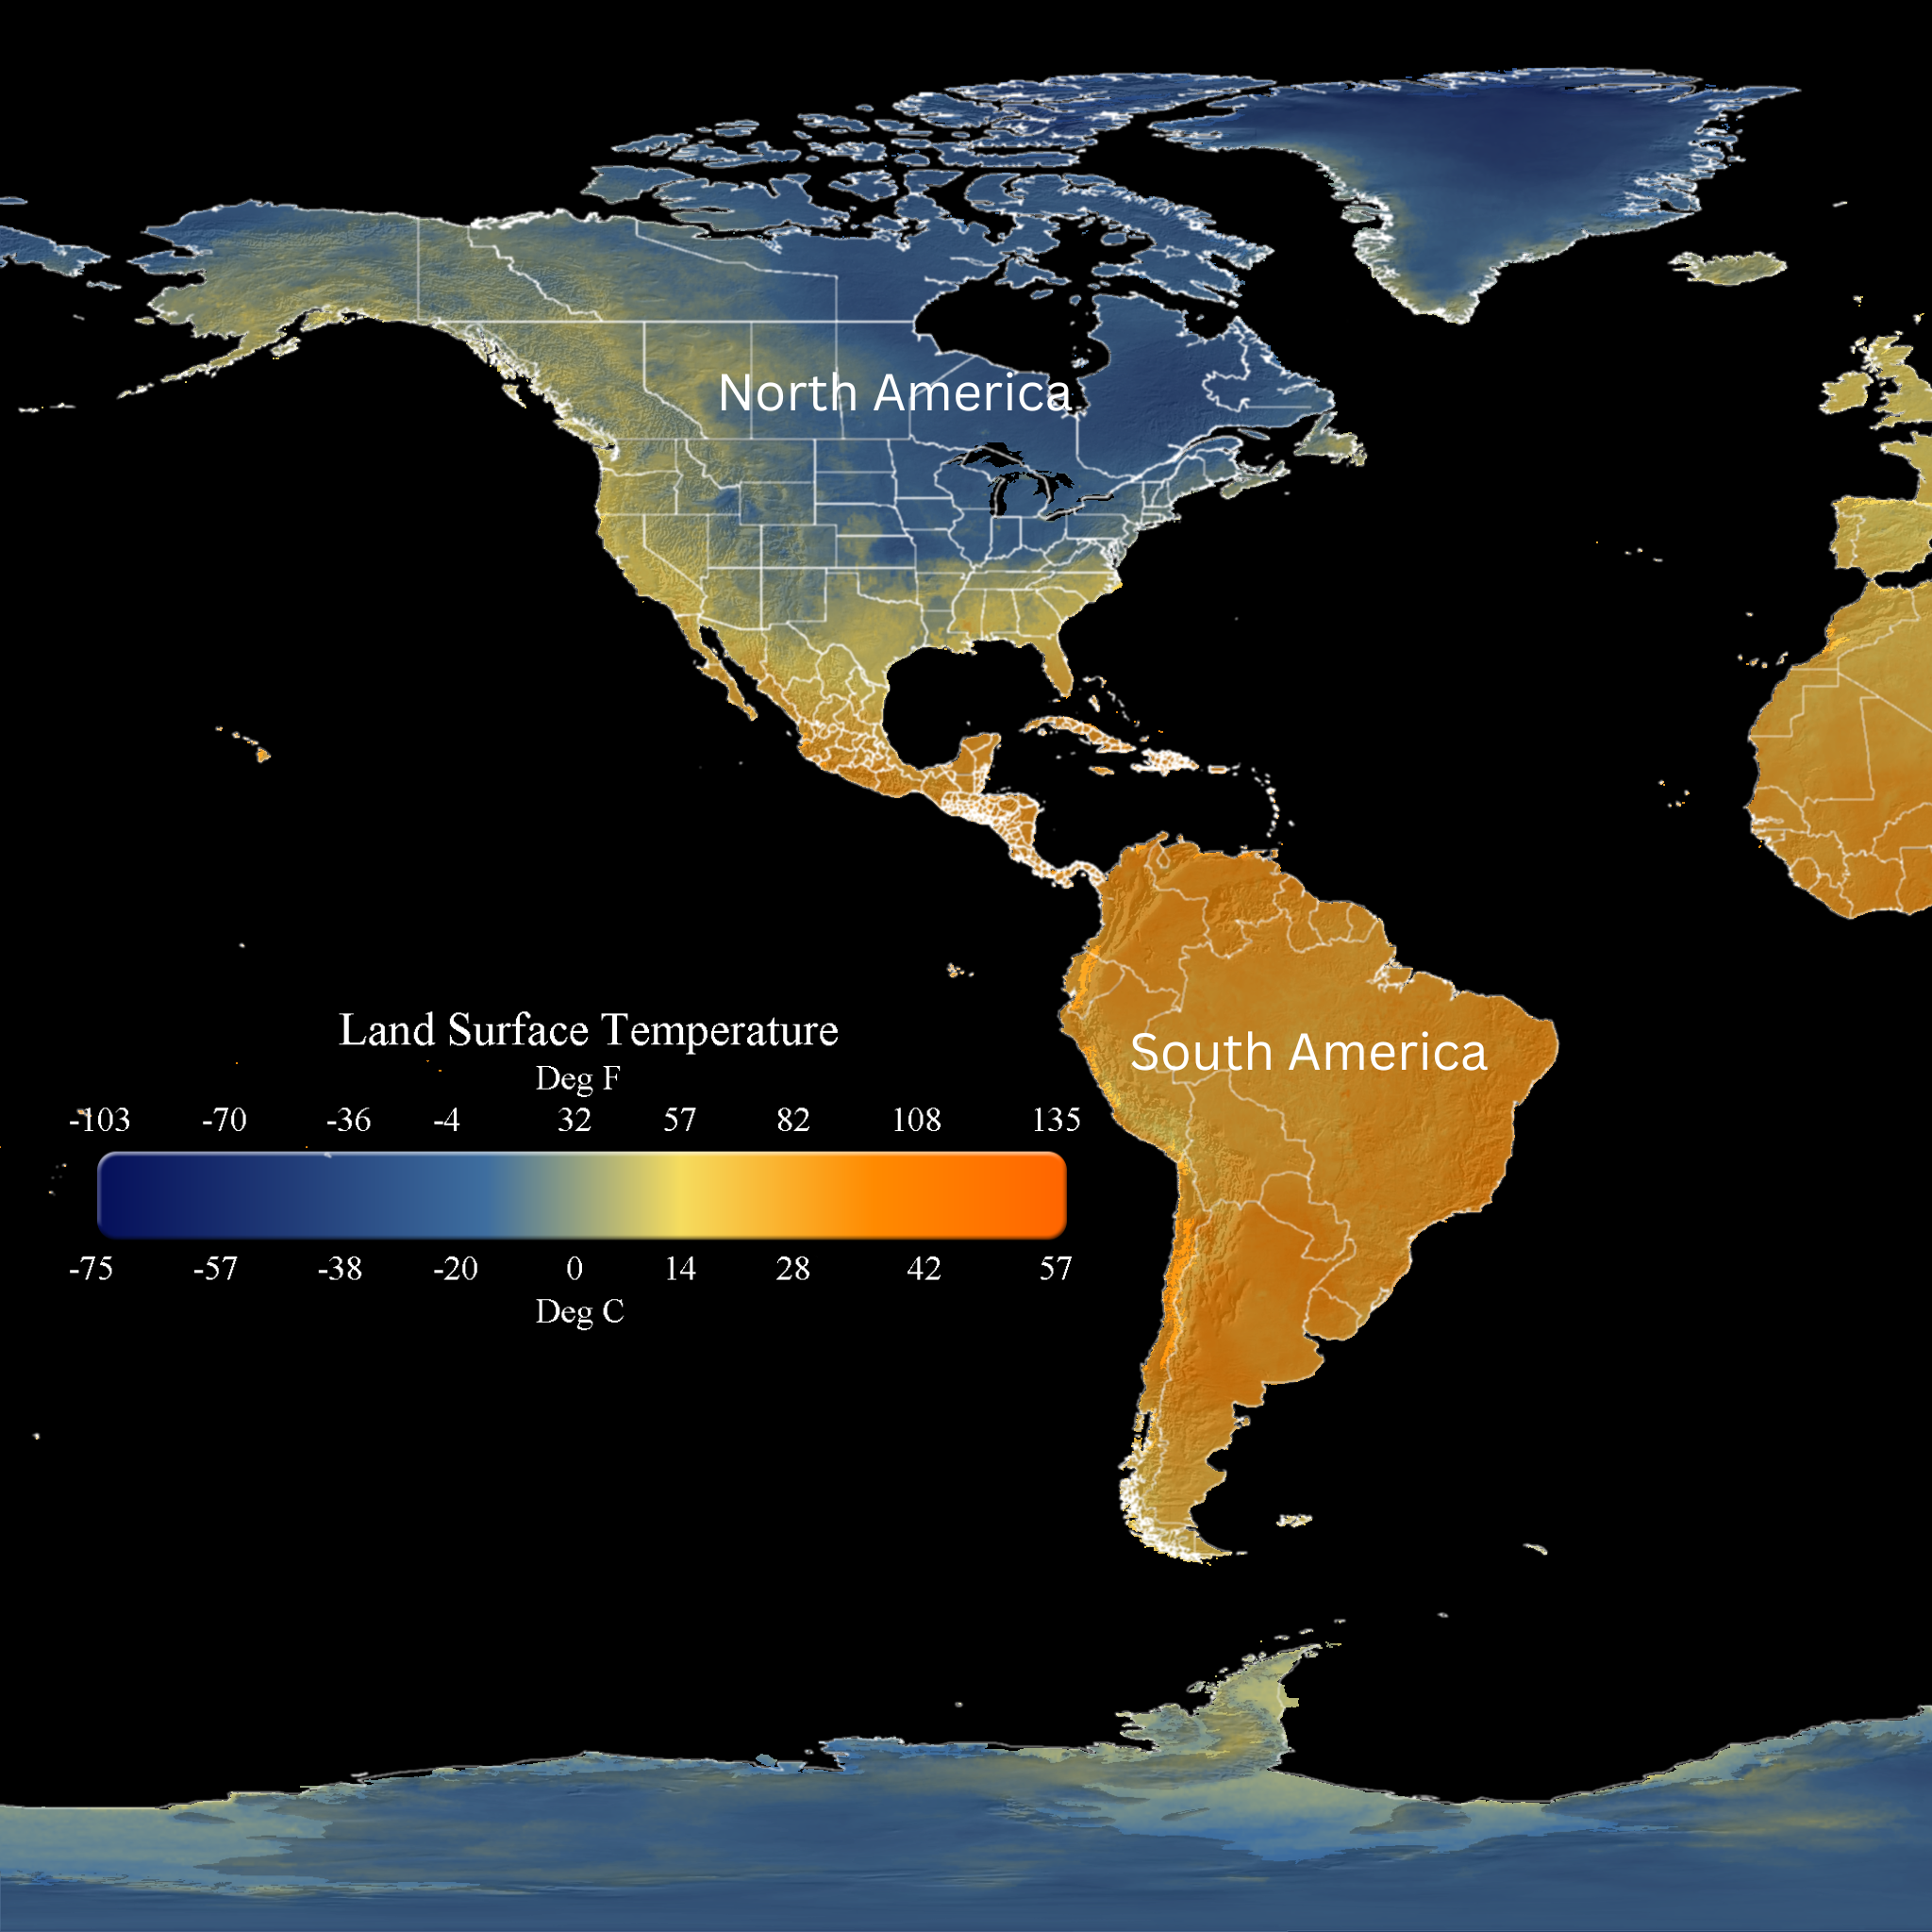
This week focuses an Arctic Blast winter storm in terms of land temperature, and compares two maps from different seasons to compare the seasonal changes.
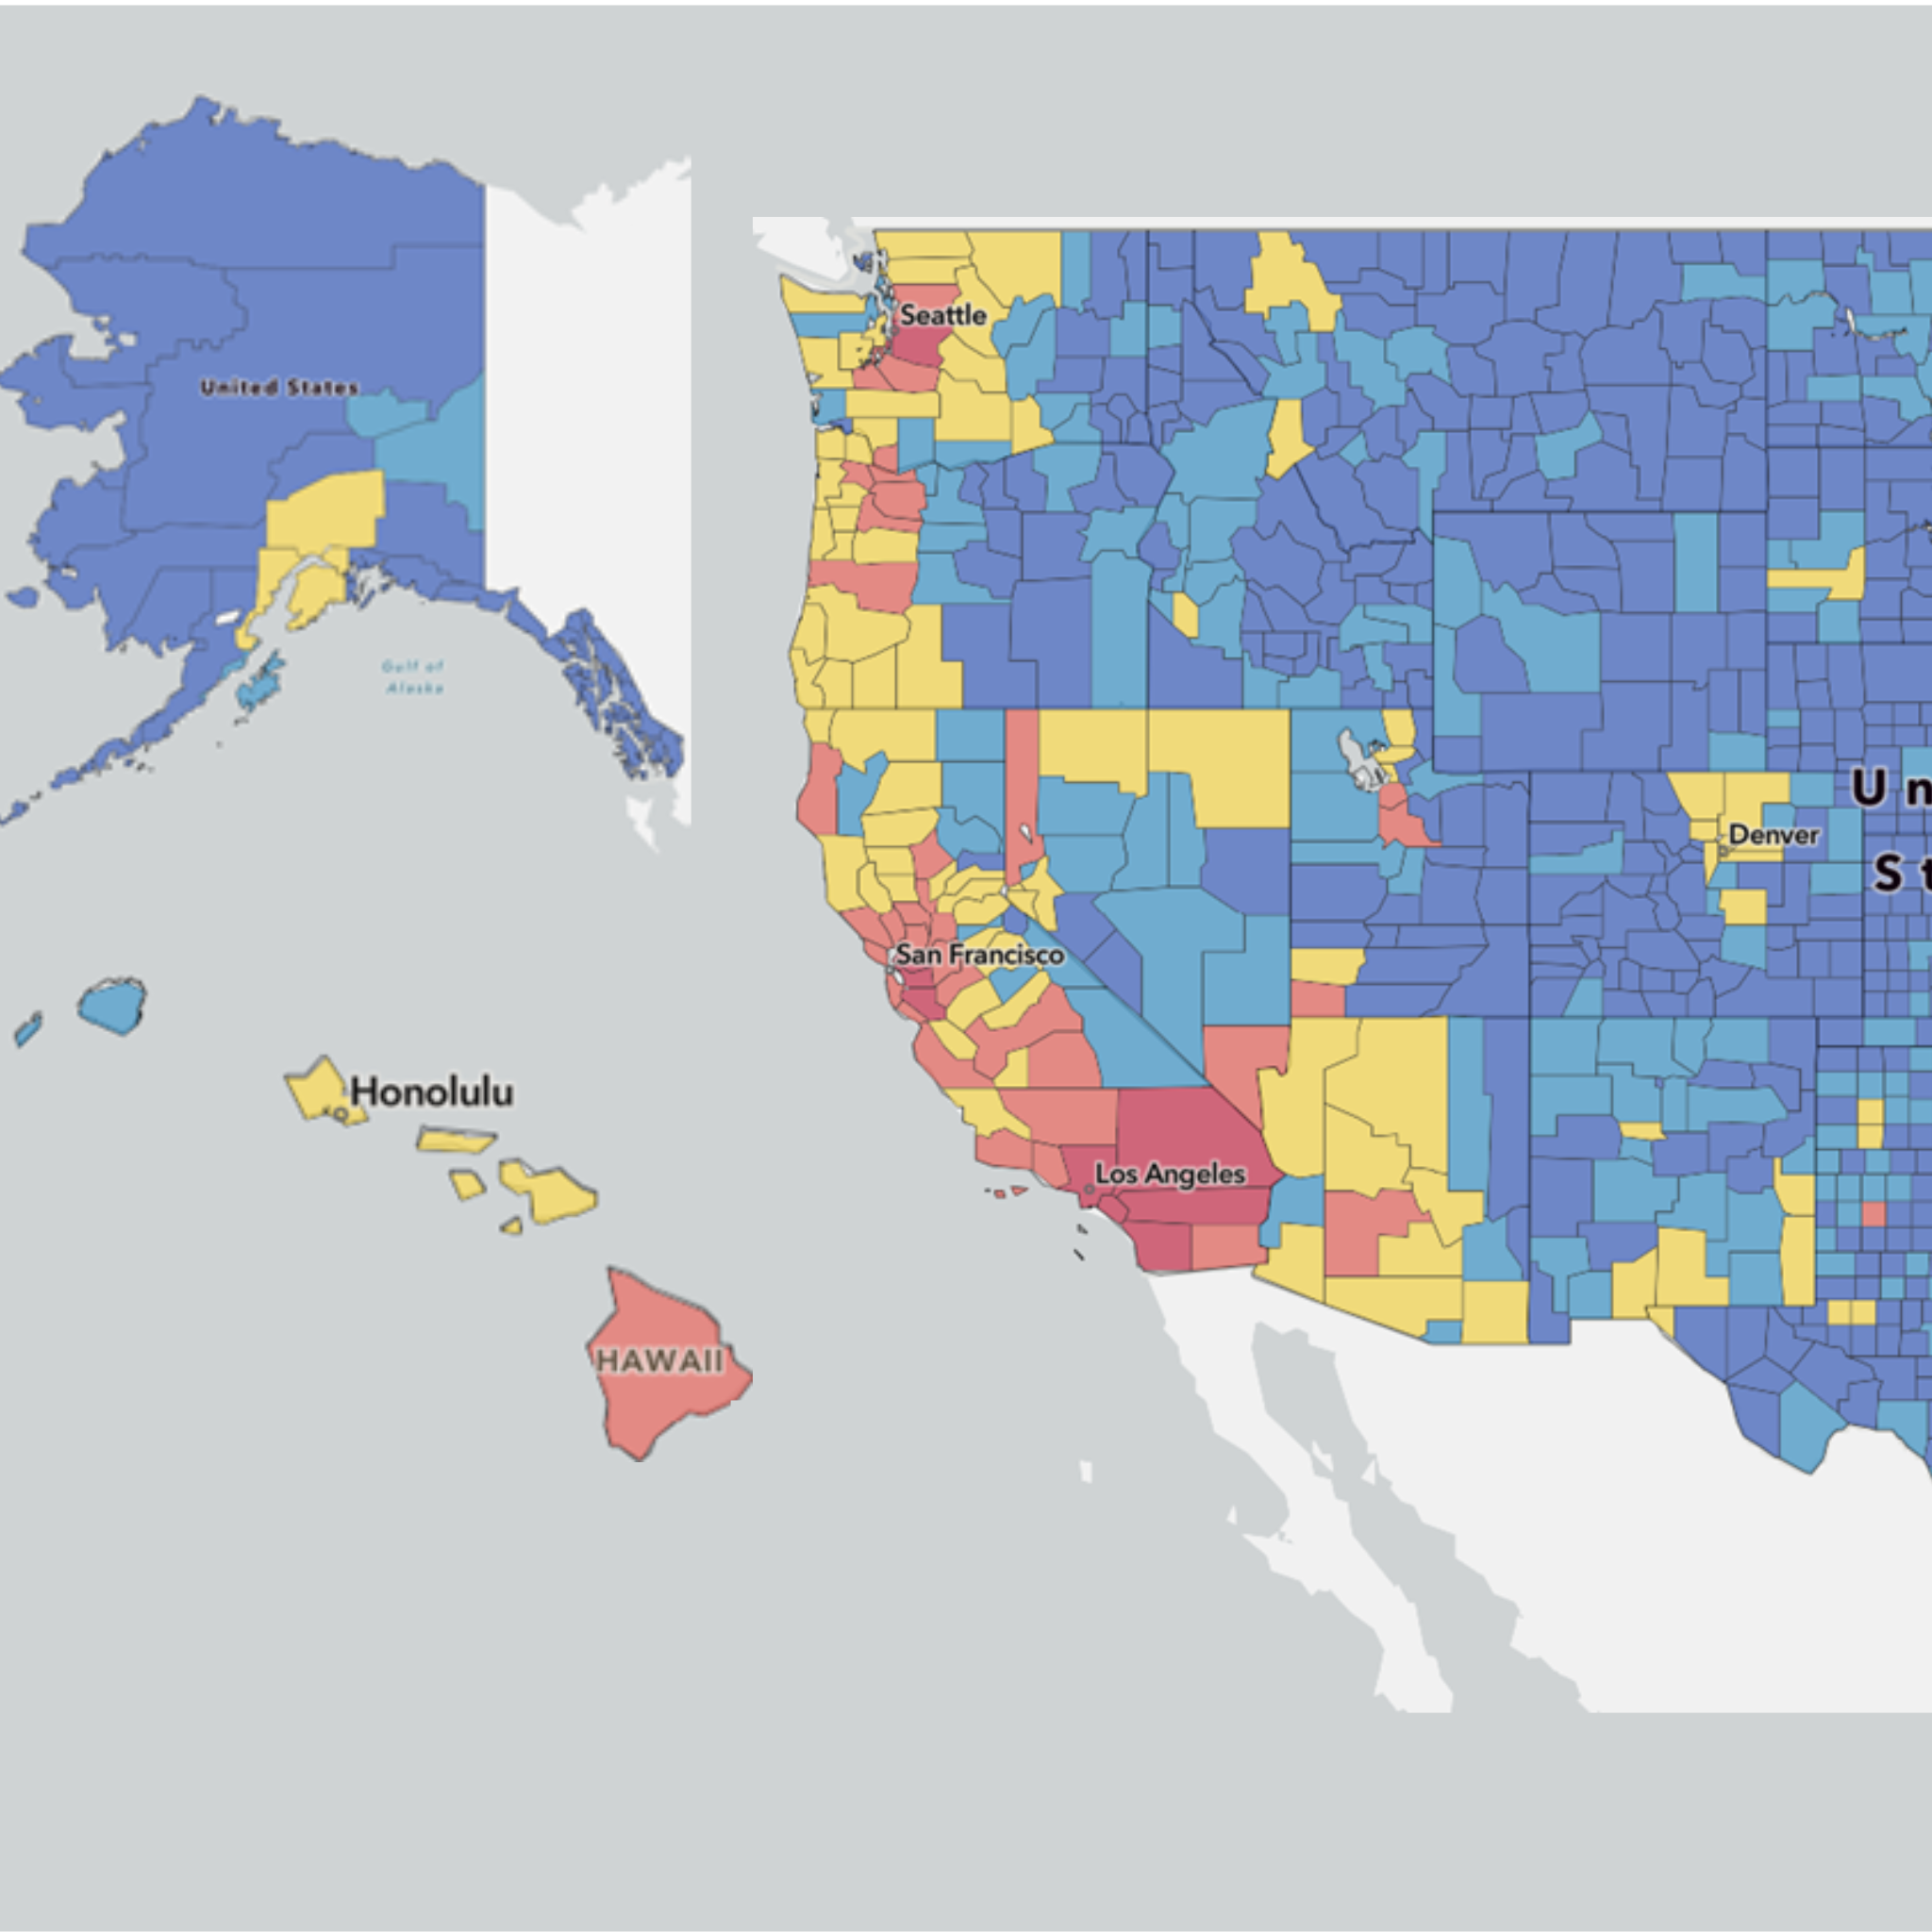
This week focuses on the the National Risk Index interactive map.

This week focuses on interactions between the hydrosphere, biosphere, and atmosphere. In an optional multimedia extension, students view 360° videos and images of the National Marine Sanctuaries.
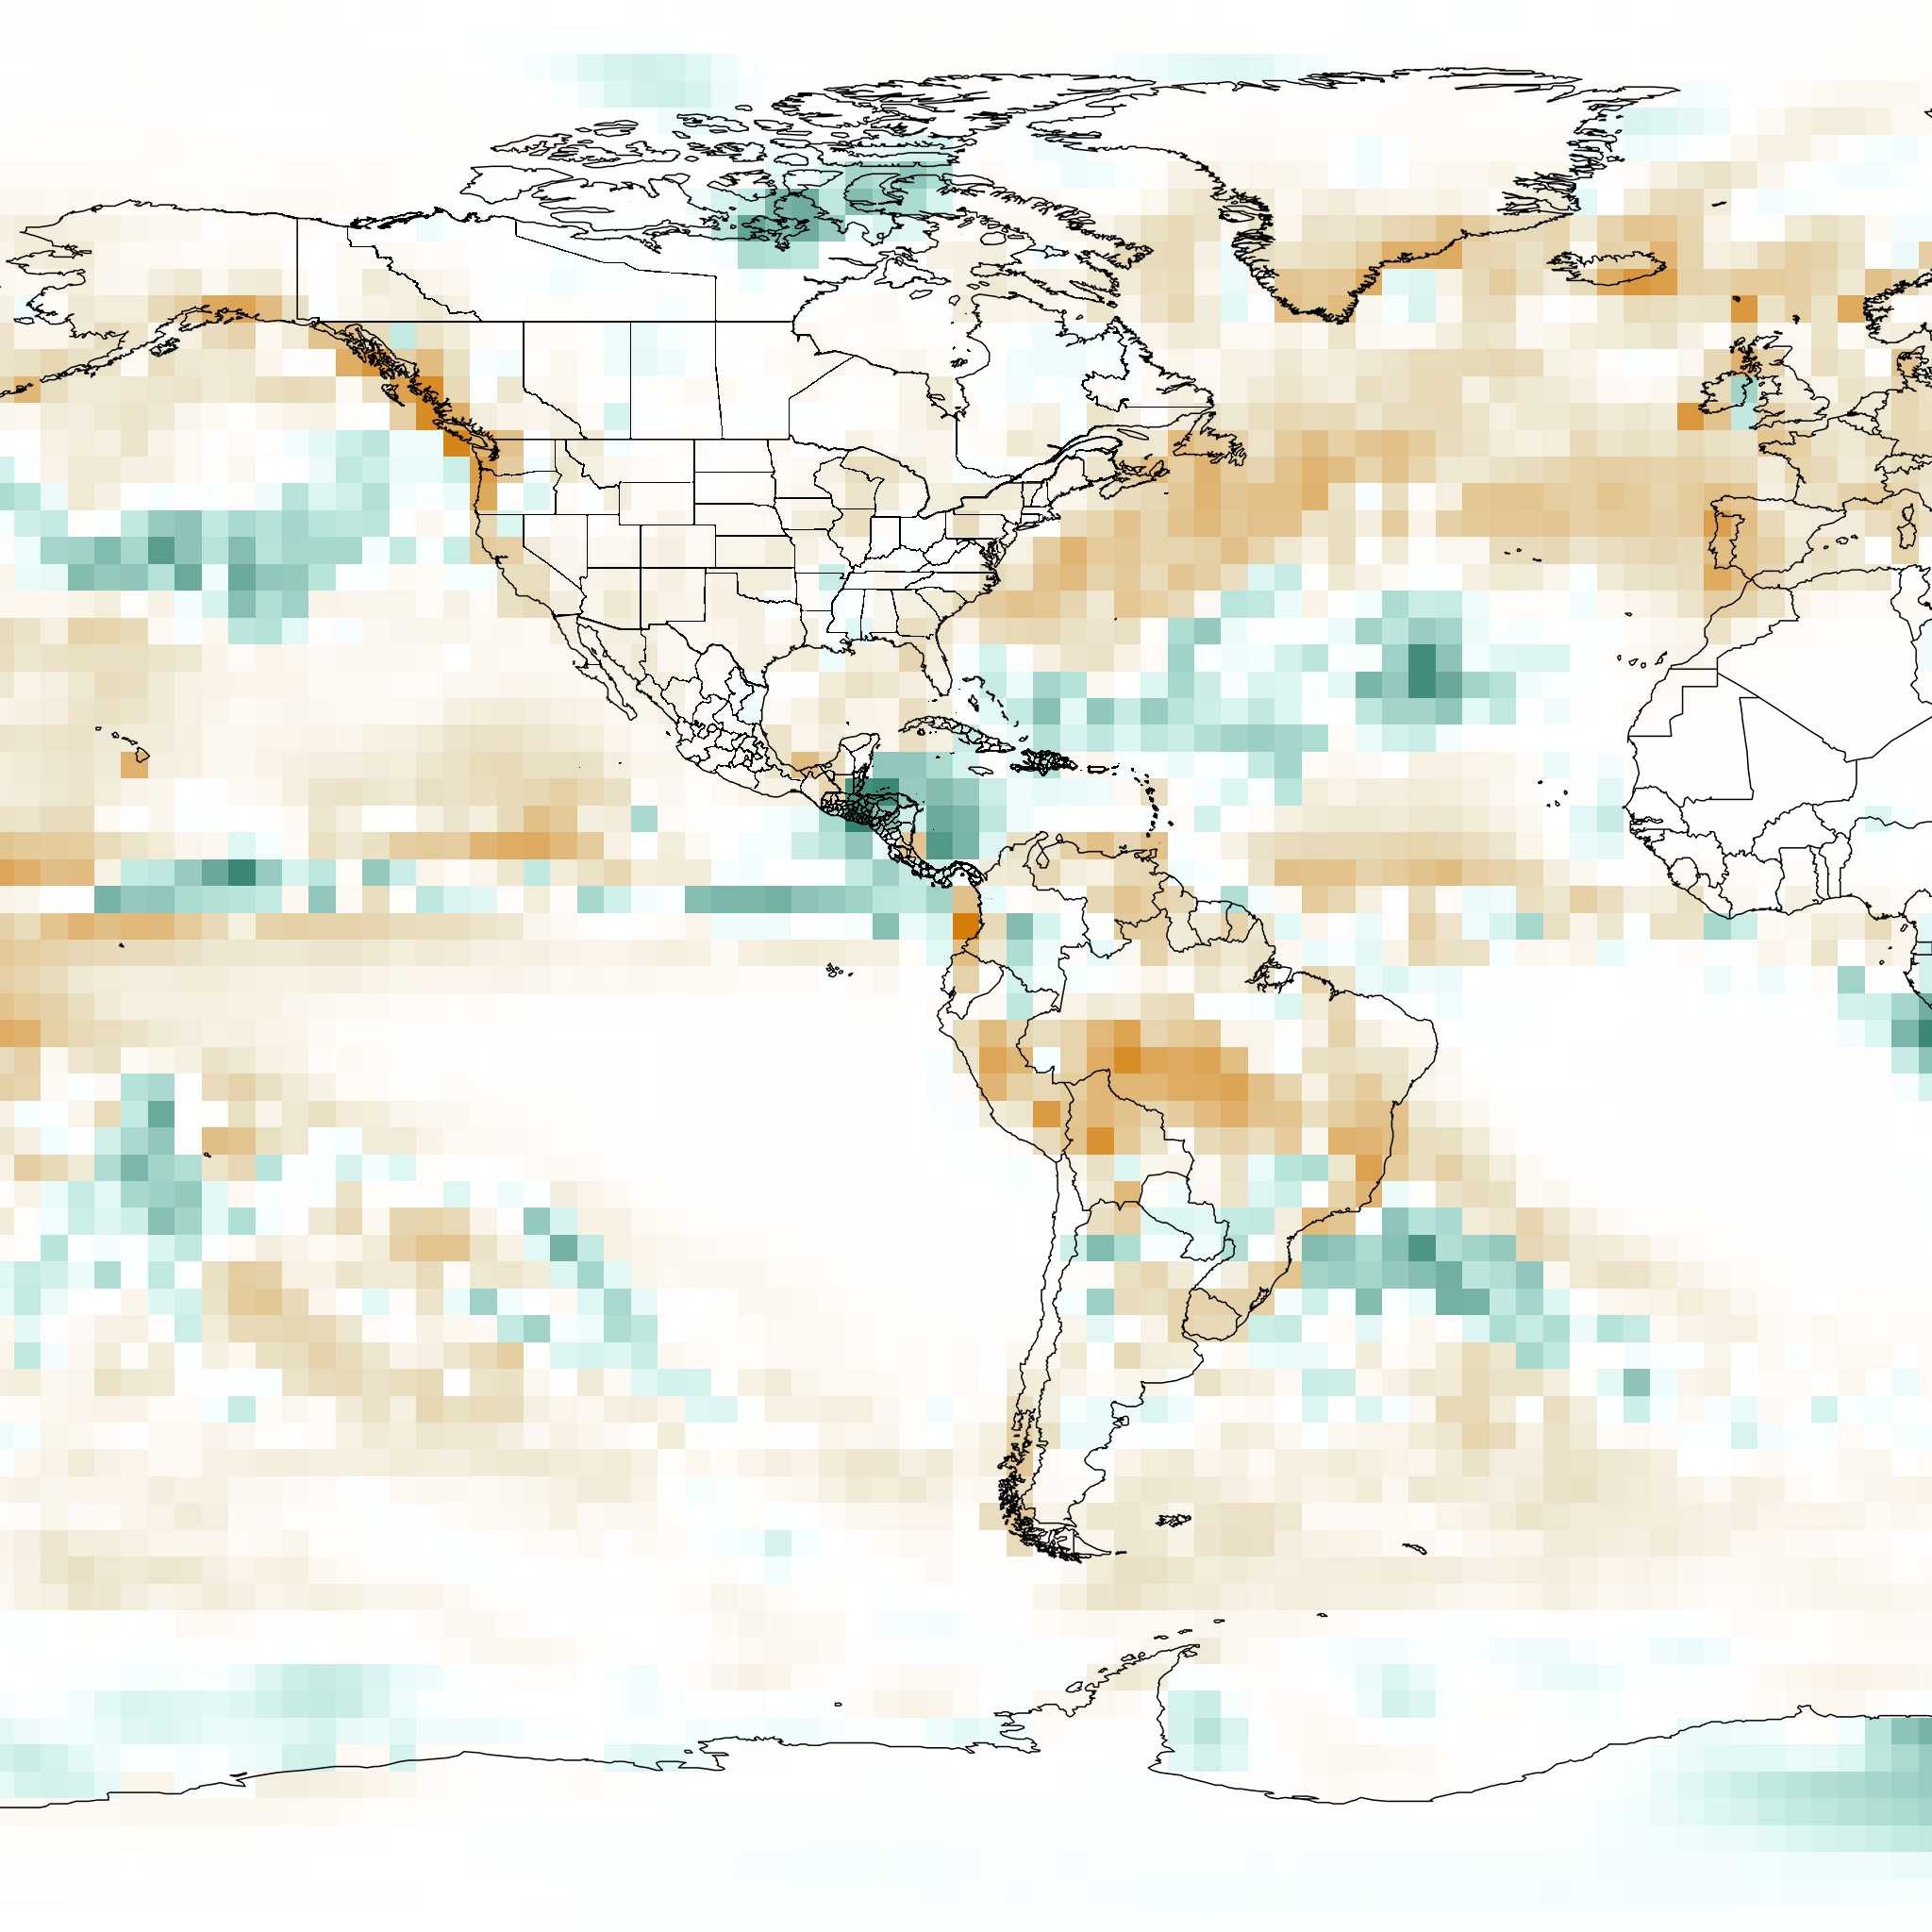
This week focuses on December 2024 Precipitation compared to the thirty year average as well as other graphs and figures.
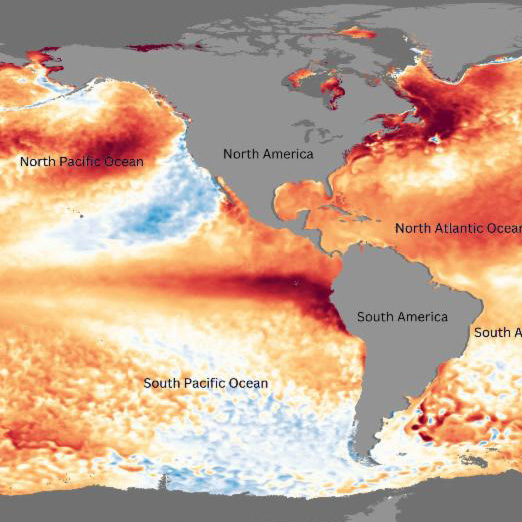
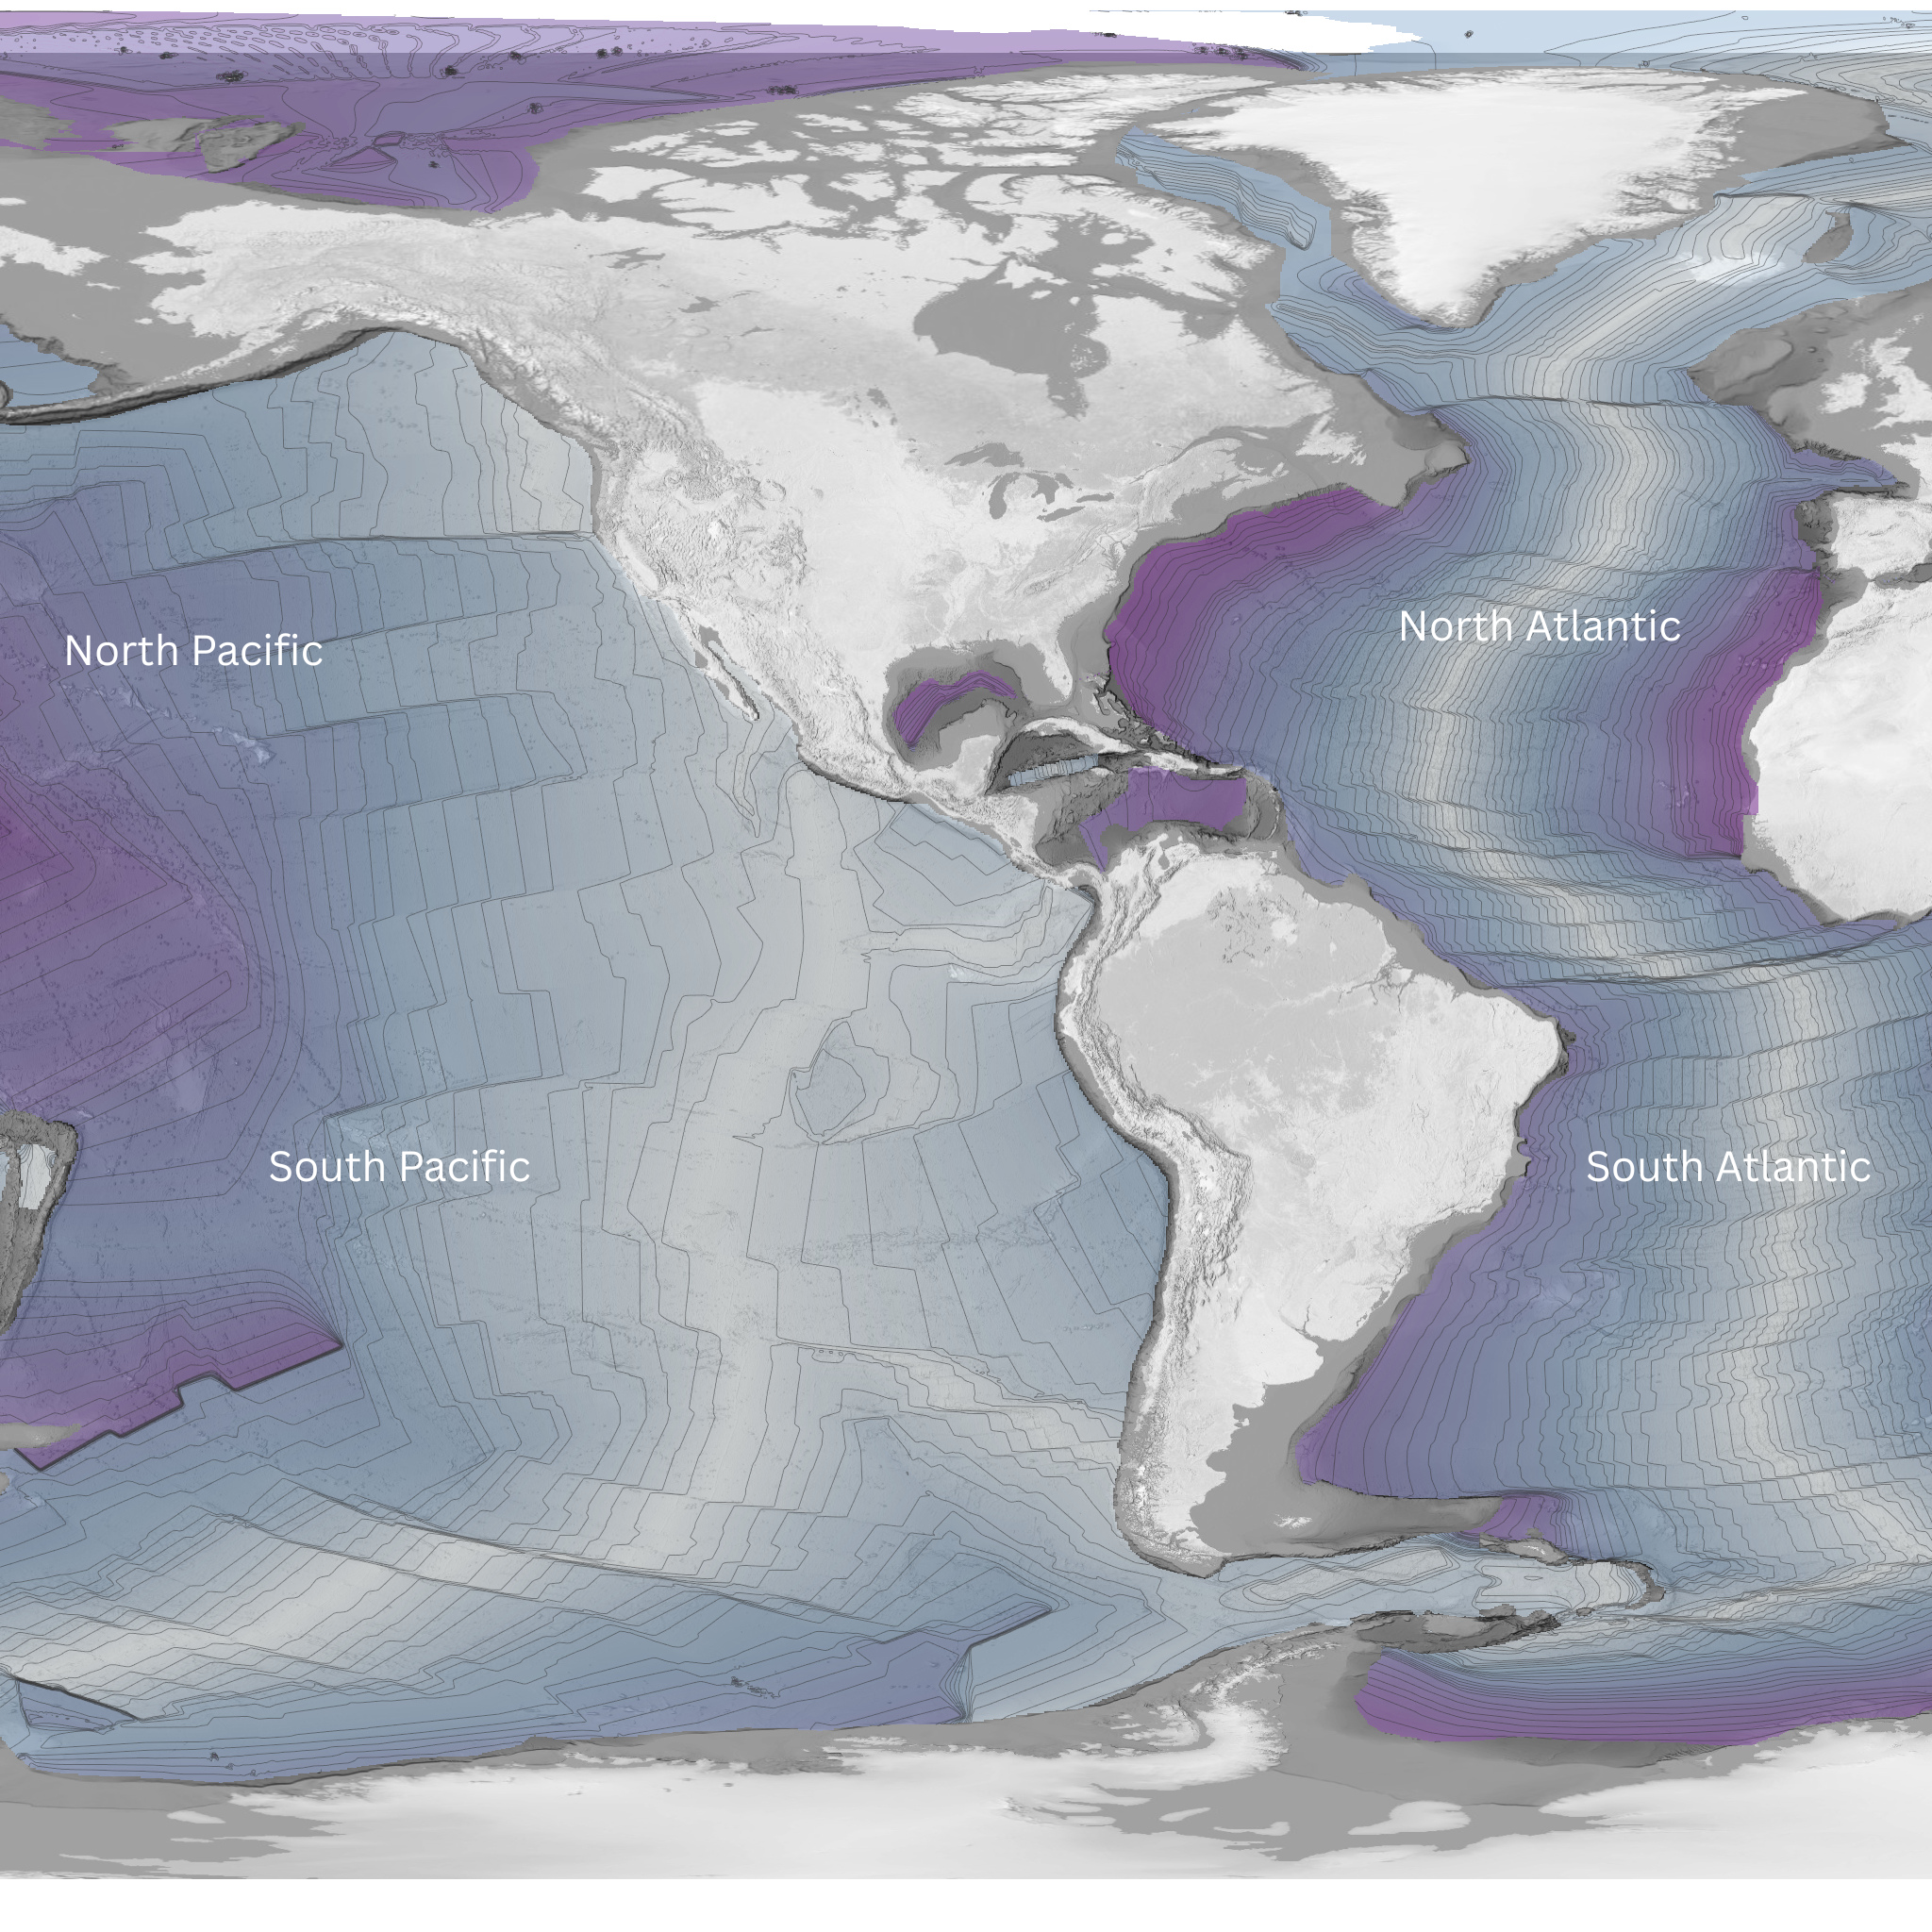
Sea Surface Temperature anomalies show the difference between current temperature from average temperature or “normal,” which allows you to see phenomena such as El Niño and La Niña.
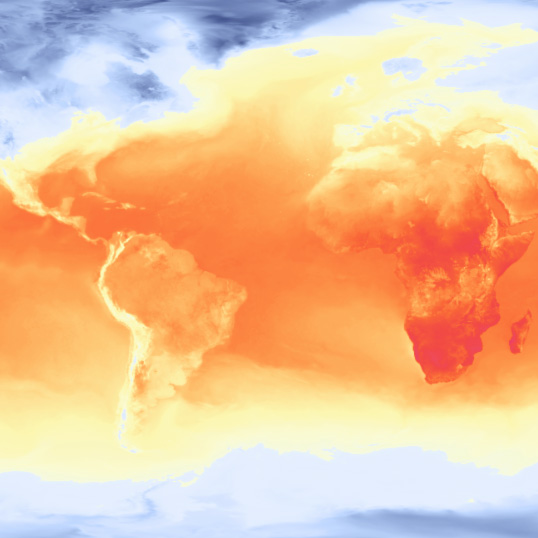
This week focuses on a winter weather forecast of air temperature, above both land and ocean, and compares two maps of different times of the same day to explore climate zones and diurnal effects.
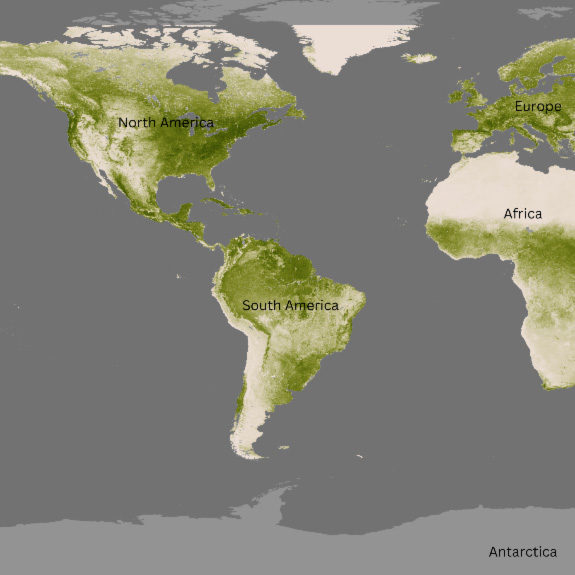
This week focuses on Septmeber 2024 vegetation and compares March to September of the same year.