Tsunami Historical Series: Cascadia - 1700
Details
Permalink to Details- Added to the Catalog
- Available for
- SOS
- Explorer
- Categories
- People: History
- Water: Tsunamis
- Keywords
- Bathymetry
- Cascadia
- Earthquakes
- Model
- Oceans
- Seismic Waves
- Tectonics
- Tsunamis
- Waves
Description
Permalink to DescriptionJust before midnight on January 27, 1700 a tsunami struck the coasts of Japan without warning since no one in Japan felt the earthquake that must have caused it. Nearly 300 years later scientists and historians in Japan and the United States solved the mystery of what caused this "orphan tsunami" through careful analysis of historical records in Japan as well as oral histories of Native Americans, sediment deposits, and ghost forests of drowned trees in the Pacific Northwest of North America, a region also known as Cascadia. They learned that this geologically active region, the Cascadia Subduction Zone, not only hosts erupting volcanoes but also produces megathrust earthquakes capable of generating devastating, ocean-crossing tsunamis. By comparing the tree rings of dead trees with those still living they could tell when the last of these great earthquakes struck the region. The trees all died in the winter of 1699 - 1700 when the coasts of northern California, Oregon, and Washington suddenly dropped 1- 2 m (3.3 - 6.6 ft.), flooding them with seawater. That much motion over such a large area requires a very large earthquake to explain it - perhaps as large as 9.2 magnitude, comparable to the Great Alaska Earthquake of 1964. Such an earthquake would have ruptured the earth along the entire length of the 1000 km (~600 mi) long fault of the Cascadia Subduction Zone and severe shaking could have lasted for 5 minutes or longer. Its tsunami would cross the Pacific Ocean and reach Japan in about 9 hours, so the earthquake must have occurred around 9:00 at night in Cascadia on January 26, 1700 (05:00 January 27 UTC).
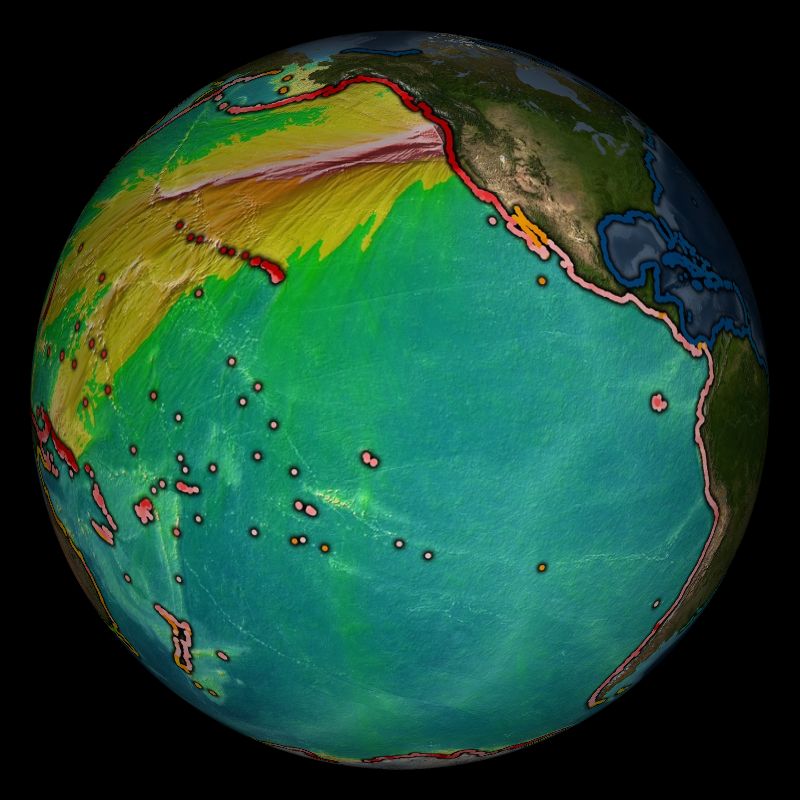
The Pacific Tsunami Warning Center (PTWC) can create an animation of a historical tsunami like this one using the same tool, the Real-Time Forecasting of Tsunamis (RIFT) forecast model, that they use for determining tsunami hazard in real time for any tsunami today. The RIFT model takes earthquake information as input and calculates how the waves move through the world's oceans, predicting their speed, wavelength, and amplitude. This animation shows these values through the simulated motion of the waves, and as they race around the globe one can also see the distance between successive wave crests (wavelength) as well as their height (half-amplitude) indicated by their color. More importantly, the model also shows what happens when these tsunami waves strike land, the very information that PTWC needs to issue tsunami hazard guidance for impacted coastlines. From the beginning, the animation shows all coastlines covered by colored points. These are initially a blue color like the undisturbed ocean to indicate normal sea level, but as the tsunami waves reach them they will change color to represent the height of the waves coming ashore, and often these values are higher than they were in the deeper waters offshore. The color scheme is based on PTWC's warning criteria, with blue-to-green representing no hazard (< 30 cm or ~1 ft.), yellow-to-orange indicating low hazard with a stay-off-the-beach recommendation (30 - 100 cm or ~1 - 3 ft.), light red-to-bright red indicating significant hazard requiring evacuation (1 - 3 m or ~3 - 10 ft.), and dark red indicating a severe hazard possibly requiring a second-tier evacuation (> 3 m or > ~10 ft.).
Toward the end of this simulated 48 hours of activity, the wave animation will transition to the "energy map" of a mathematical surface representing the maximum rise in sea level on the open ocean caused by the tsunami, a pattern that indicates that the kinetic energy of the tsunami was not distributed evenly across the oceans but instead forms a highly directional "beam" such that the tsunami was far more severe in the middle of the "beam" of energy than on its sides. This pattern also generally correlates to the coastal impacts; note how those coastlines directly in the "beam" have a much higher impact than those to either side of it.
The full report about the Orphan Tsunami of 1700 can be found here.
For a YouTube version of this animation, please see: https://youtu.be/4W2iUl0VB8c
.Next Generation Science Standards
Permalink to Next Generation Science StandardsCross-cutting Concepts
Permalink to Cross-cutting ConceptsGrades 3–5
C3 Scale Proportion and Quantity. Students recognize natural objects and observable phenomena exist from the very small to the immensely large. They use standard units to measure and describe physical quantities such as weight, time, temperature, and volume.
C5 Energy and Matter. Students learn matter is made of particles and energy can be transferred in various ways and between objects. Students observe the conservation of matter by tracking matter flows and cycles before and after processes and recognizing the total weight of substances does not change.
Grades 6–8
C4 Systems and System Models. Students can understand that systems may interact with other systems; they may have sub-systems and be a part of larger complex systems. They can use models to represent systems and their interactions—such as inputs, processes and outputs—and energy, matter, and information flows within systems. They can also learn that models are limited in that they only represent certain aspects of the system under study.
C5 Energy and Matter. Students learn matter is conserved because atoms are conserved in physical and chemical processes. They also learn within a natural or designed system, the transfer of energy drives the motion and/or cycling of matter. Energy may take different forms (e.g. energy in fields, thermal energy, energy of motion). The transfer of energy can be tracked as energy flows through a designed or natural system.
Grades 9–12
C3 Scale Proportion and Quantity. Students understand the significance of a phenomenon is dependent on the scale, proportion, and quantity at which it occurs. They recognize patterns observable at one scale may not be observable or exist at other scales, and some systems can only be studied indirectly as they are too small, too large, too fast, or too slow to observe directly. Students use orders of magnitude to understand how a model at one scale relates to a model at another scale. They use algebraic thinking to examine scientific data and predict the effect of a change in one variable on another (e.g., linear growth vs. exponential growth).
C4 Systems and System Models. Students can investigate or analyze a system by defining its boundaries and initial conditions, as well as its inputs and outputs. They can use models (e.g., physical, mathematical, computer models) to simulate the flow of energy, matter, and interactions within and between systems at different scales. They can also use models and simulations to predict the behavior of a system, and recognize that these predictions have limited precision and reliability due to the assumptions and approximations inherent in the models. They can also design systems to do specific tasks.
C5 Energy and Matter. Students learn that the total amount of energy and matter in closed systems is conserved. They can describe changes of energy and matter in a system in terms of energy and matter flows into, out of, and within that system. They also learn that energy cannot be created or destroyed. It only moves between one place and another place, between objects and/or fields, or between systems. Energy drives the cycling of matter within and between systems. In nuclear processes, atoms are not conserved, but the total number of protons plus neutrons is conserved.
Disciplinary Core Ideas
Permalink to Disciplinary Core IdeasGrades 3–5
ESS1.C The History of Planet Earth. Certain features on Earth can be used to order events that have occurred in a landscape.
ESS2.A Earth Materials and Systems. Four major Earth systems interact. Rainfall helps to shape the land and affects the types of living things found in a region. Water, ice, wind, organisms, and gravity break rocks, soils, and sediments into smaller pieces and move them around
ESS2.B Plate Tectonics & Large Scale Interactions. Earth’s physical features occur in patterns, as do earthquakes and volcanoes. Maps can be used to locate features and determine patterns in those events.
ESS2.C The Roles of Water in Earth's Processes. Most of Earth’s water is in the ocean and much of the Earth’s fresh water is in glaciers or underground.
ESS3.B Natural Hazards. A variety of hazards result from natural processes; humans cannot eliminate hazards but can reduce their impacts.
PS3.A Definitions of Energy. Moving objects contain energy. The faster the object moves, the more energy it has. Energy can be moved from place to place by moving objects, or through sound, light, or electrical currents. Energy can be converted from one form to another form.
PS4.A Wave Properties. Waves are regular patterns of motion, which can be made in water by disturbing the surface. Waves of the same type can differ in amplitude and wavelength. Waves can make objects move.
Grades 6–8
ESS1.C The History of Planet Earth. Rock strata and the fossil record can be used as evidence to organize the relative occurrence of major historical events in Earth’s history.
ESS2.A Earth Materials and Systems. Energy flows and matter cycles within and among Earth’s systems, including the sun and Earth’s interior as primary energy sources. Plate tectonics is one result of these processes.
ESS2.B Plate Tectonics & Large Scale Interactions. Plate tectonics is the unifying theory that explains movements of rocks at Earth’s surface and geological history. Maps are used to display evidence of plate movement.
ESS2.C The Roles of Water in Earth's Processes. Water cycles among land, ocean, and atmosphere, and is propelled by sunlight and gravity. Density variations of sea water drive interconnected ocean currents. Water movement causes weathering and erosion, changing landscape features.
ESS3.B Natural Hazards. Mapping the history of natural hazards in a region and understanding related geological forces can help forecast the locations and likelihoods of future events, such as volcanic eruptions, earthquakes and severe weather.
PS3.A Definitions of Energy. Kinetic energy can be distinguished from the various forms of potential energy. Energy changes to and from each type can be tracked through physical or chemical interactions. The relationship between the temperature and the total energy of a system depends on the types, states, and amounts of matter.
PS4.A Wave Properties. A simple wave model has a repeating pattern with a specific wavelength, frequency, and amplitude, and mechanical waves need a medium through which they are transmitted. This model can explain many phenomena including sound and light. Waves can transmit energy
Grades 9–12
ESS2.A Earth Materials and Systems. Feedback effects exist within and among Earth’s systems.The geological record shows that changes to global and regional climate can be caused by interactions among changes in the sun’s energy output or Earth’s orbit, tectonic events, ocean circulation, volcanic activity, glaciers, vegetation, and human activities.
ESS2.B Plate Tectonics & Large Scale Interactions. Radioactive decay within Earth’s interior contributes to thermal convection in the mantle. Plate tectonics can be viewed as the surface expression of mantle convection.
ESS2.C The Roles of Water in Earth's Processes. The planet’s dynamics are greatly influenced by water’s unique chemical and physical properties.
ESS3.B Natural Hazards. Natural hazards and other geological events have shaped the course of human history at local, regional, and global scales. Human activities can contribute to the frequency and intensity of some natural hazards.
PS3.A Definitions of Energy. The total energy within a system is conserved. Energy transfer within and between systems can be described and predicted in terms of energy associated with the motion or configuration of particles (objects).
PS4.A Wave Properties. The wavelength and frequency of a wave are related to one another by the speed of the wave, which depends on the type of wave and the medium through which it is passing. Waves can be used to transmit information and energy.
Notable Features
Permalink to Notable Features- Tsunami generated by a ~9.2 magnitude Cascadia earthquake in 1700 along a ~600 mile long fault from Vancouver Island, British Columbia to northern California.
- A tsunami is a series of waves, not just a single wave.
- In the open ocean, tsunami waves can travel at speeds up to 500 miles an hour, as fast as a jet plane.
- Tsunami waves may be small in the open ocean, but wave heights can increase substantially as they approach the shore (indicated by the colored dots).
- A majority of coastal locations in the Pacific experienced significant hazards (indicated by the red dots) due to this tsunami.
- The wave "energy map" of maximum wave heights show that those coastlines directly in the energy "beam" of red/yellow had a much higher impact than those to either side of it.