Koppen-Geiger Climate Changes - 1901 - 2100
Details
Permalink to Details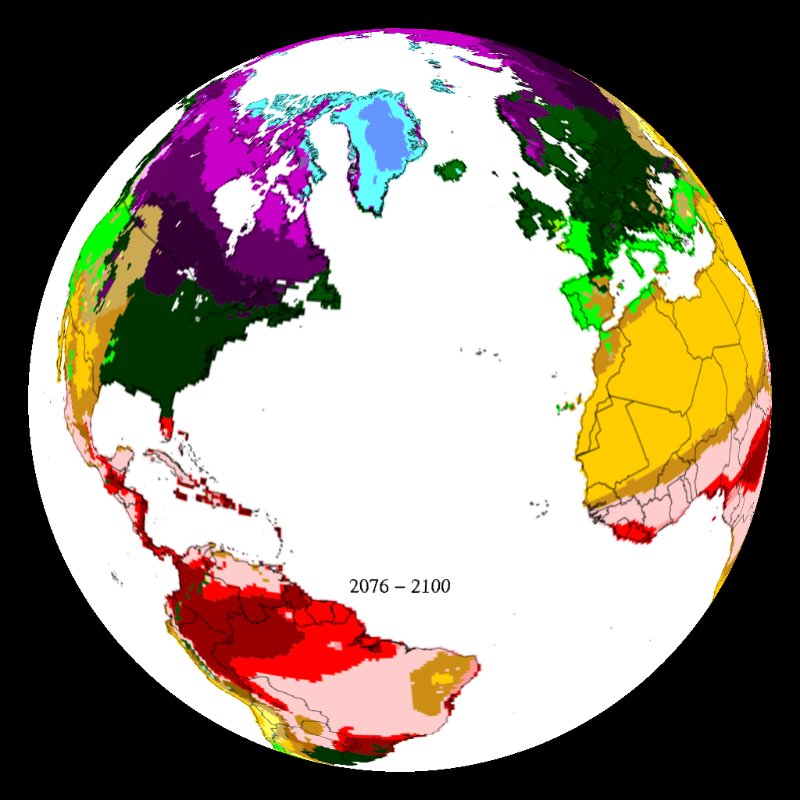
Description
Permalink to DescriptionKöppen climate classification is a widely used vegetation-based empirical climate classification system developed by German botanist-climatologist Wladimir Köppen. It's based on the idea that climate is best defined by native vegetation. The formulas used in the classification correspond to those of the vegetation zones (biomes) that were being mapped for the first time in the late 19th century. It was first published in 1884 and was revised until 1940 with collaboration by German climatologist Rudolf Geiger.
This particular version of Köppen-Geiger shows the changes in the climate regions and biomes over time (from 1901 - 2100) using observations for 1901 - 2000 and the A1F1 IPCC climate scenario for 2001 - 2100. A1F1 is the worst case scenario future projection for climate change modeling. You can find out more information on how this was made by visiting World Maps of Köppen-Geiger Climate Classisification website.
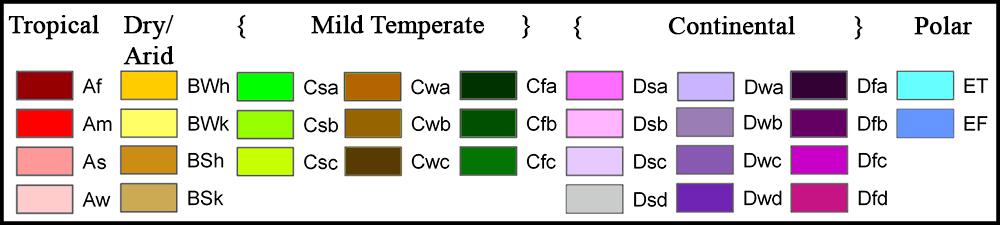
Köppen-Geiger's classification is based on a subdivision of terrestrial climates into five major types, which are represented by the capital letters A - E. Each of these except for B is defined by temperature criteria. Type B designates climates in which the controlling factor on vegetation is dryness. The second subdivision (second letter) clarifies further the type of climate based on precipitation and temperature. Although Köppen-Geiger's classification did not account for the uniqueness of highland climate regions, the highland climate category, or H climate, is sometimes added to modified maps to cover the elevations higher than 1,500 meters.
The second legend for this dataset, describing the climate letter codes, is included in the dataset as a layer called Letter Code Legend. You can toggle the legend on as needed. You will find it by tapping on the "Layers" tab in the iOS SOS Remote App 4.0+.
Notable Features
Permalink to Notable Features- Red/pink represent tropical biomes and can be seen expanding to higher latitudes
- Yellow/light brown represents arid/dry biomes and can be seen expanding into mild temperate and continental zones
- Green/dark brown represents mild temperate biomes and can be seen expanding northward while losing ground in the low latitudes
- Violet/lavendar represents continental biomes and can be seen expanding northward taking up much of the polar regions
- Blue represents polar biomes and dramatically decrease in size
- Changes in biomes and climate zones are seen to change fairly dramatically by 2100 according to IPCC A1F1 scenario
Data Source
Permalink to Data SourceRubel, F., and M. Kottek, 2010: Observed and projected climate shifts 1901-2100 depicted by world maps of the Köppen-Geiger climate classification. Meteorol. Z.