Human Transportation
Details
Permalink to Details- Added to the Catalog
- Available for
- SOS
- Explorer
- Categories
- People: Transportation, Energy
- Keywords
- Air Traffic
- Globalization
- Human Activity
- Nighttime Lights
- Population
- Roads
- Shipping Routes
- Transportation
Description
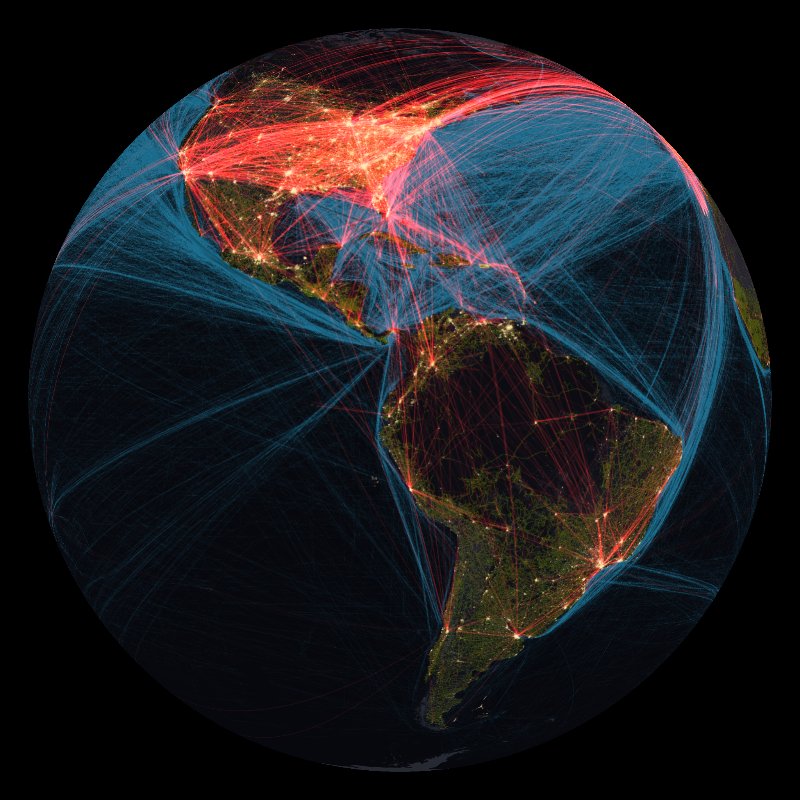
Permalink to DescriptionThis image of the Nighttime Lights - 2012 is combined with data showing the human footprint of global transportation on land, in the air, and by sea. The base map of this image shows nighttime lights visible from space, which indicates areas where people live, work, and consume energy. Red lines represent 87,000 daily flights connecting cities and cultures around the world. Blue lines represent the paths of 3500 commercial vessels over the course of a year, which is only 10% of the total ocean shipping traffic. Green lines represent the world's roads, used by over 1 billion motor vehicles. This colorful globe shows the interconnected nature of the world, but also how much energy we use to move people and goods around the planet's surface.
It's important to note that the nighttime lights data includes all lights at night, not just electricity; for example, both natural and man-made fires as well as gas flaring from fossil fuel extraction can be seen in places like west central Australia, West Africa, and Siberia.
Next Generation Science Standards
Permalink to Next Generation Science StandardsCross-cutting Concepts
Permalink to Cross-cutting ConceptsGrades K–2
C1 Patterns. Children recognize that patterns in the natural and human designed world can be observed, used to describe phenomena, and used as evidence
C3 Scale Proportion and Quantity. Students use relative scales (e.g., bigger and smaller; hotter and colder; faster and slower) to describe objects. They use standard units to measure length.
C5 Energy and Matter. Students observe objects may break into smaller pieces, be put together into larger pieces, or change shapes.
Grades 3–5
C1 Patterns. Students identify similarities and differences in order to sort and classify natural objects and designed products. They identify patterns related to time, including simple rates of change and cycles, and to use these patterns to make predictions.
C4 Systems and System Models. Students understand that a system is a group of related parts that make up a whole and can carry out functions its individual parts cannot. They can also describe a system in terms of its components and their interactions.
Grades 6–8
C1 Patterns. Students recognize that macroscopic patterns are related to the nature of microscopic and atomic-level structure. They identify patterns in rates of change and other numerical relationships that provide information about natural and human designed systems. They use patterns to identify cause and effect relationships, and use graphs and charts to identify patterns in data.
C4 Systems and System Models. Students can understand that systems may interact with other systems; they may have sub-systems and be a part of larger complex systems. They can use models to represent systems and their interactions—such as inputs, processes and outputs—and energy, matter, and information flows within systems. They can also learn that models are limited in that they only represent certain aspects of the system under study.
Grades 9–12
C1 Patterns. Students observe patterns in systems at different scales and cite patterns as empirical evidence for causality in supporting their explanations of phenomena. They recognize classifications or explanations used at one scale may not be useful or need revision using a different scale; thus requiring improved investigations and experiments. They use mathematical representations to identify certain patterns and analyze patterns of performance in order to re-engineer and improve a designed system.
C4 Systems and System Models. Students can investigate or analyze a system by defining its boundaries and initial conditions, as well as its inputs and outputs. They can use models (e.g., physical, mathematical, computer models) to simulate the flow of energy, matter, and interactions within and between systems at different scales. They can also use models and simulations to predict the behavior of a system, and recognize that these predictions have limited precision and reliability due to the assumptions and approximations inherent in the models. They can also design systems to do specific tasks.
Disciplinary Core Ideas
Permalink to Disciplinary Core IdeasGrades K–2
ESS3.C Human Impact on Earth systems. Things people do can affect the environment but they can make choices to reduce their impacts.
PS4.C Information Technologies and Instrumentation. People use devices to send and receive information.
Grades 3–5
ESS3.C Human Impact on Earth systems. Societal activities have had major effects on the land, ocean, atmosphere, and even outer space. Societal activities can also help protect Earth’s resources and environments.
PS4.A Wave Properties. Waves are regular patterns of motion, which can be made in water by disturbing the surface. Waves of the same type can differ in amplitude and wavelength. Waves can make objects move.
PS4.C Information Technologies and Instrumentation. Patterns can encode, send, receive and decode information.
Grades 6–8
ESS3.C Human Impact on Earth systems. Human activities have altered the biosphere, sometimes damaging it, although changes to environments can have different impacts for different living things. Activities and technologies can be engineered to reduce people’s impacts on Earth.
PS4.A Wave Properties. A simple wave model has a repeating pattern with a specific wavelength, frequency, and amplitude, and mechanical waves need a medium through which they are transmitted. This model can explain many phenomena including sound and light. Waves can transmit energy
PS4.C Information Technologies and Instrumentation. Waves can be used to transmit digital information. Digitized information is comprised of a pattern of 1s and 0s.
Grades 9–12
ESS3.C Human Impact on Earth systems. Sustainability of human societies and the biodiversity that supports them requires responsible management of natural resources, including the development of technologies that produce less pollution and waste and that preclude ecosystem degradation.
PS4.A Wave Properties. The wavelength and frequency of a wave are related to one another by the speed of the wave, which depends on the type of wave and the medium through which it is passing. Waves can be used to transmit information and energy.
PS4.B Electromagnetic Radiation. Both an electromagnetic wave model and a photon model explain features of electromagnetic radiation broadly and describe common applications of electromagnetic radiation.
PS4.C Information Technologies and Instrumentation. Large amounts of information can be stored and shipped around as a result of being digitized.
Notable Features
Permalink to Notable Features- The base map of this image shows nighttime lights visible from space, which indicates areas where people live, work, and consume energy.
- Red lines represent 87,000 daily flights connecting cities and cultures around the world.
- Blue lines represent the paths of 3500 commercial vessels over the course of a year, which is only 10% of the total ocean shipping traffic.
- Green lines represent the world's roads, used by over 1 billion motor vehicles.