The Pandemic and Air Quality
Details
Permalink to Details- Added to the Catalog
- Available for
- SOS
- Explorer
- Categories
- Air: Live Programs
- Extras: Live Programs
- People: Live Programs
Description
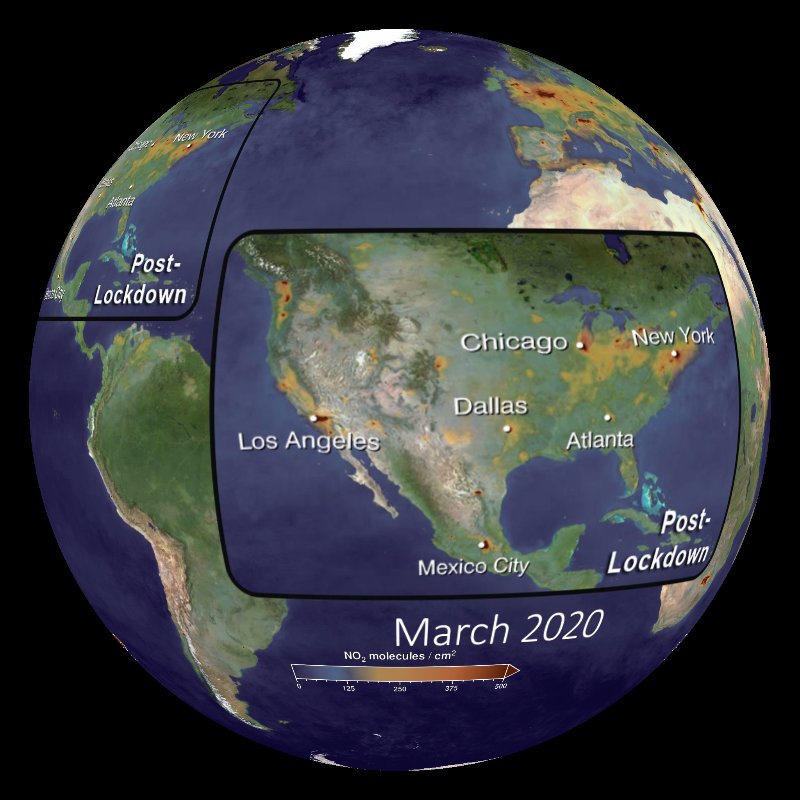
Permalink to DescriptionThe COVID-19 pandemic has changed almost every aspect of our lives, especially in the early days. In early 2020, a new coronavirus had spread around the world, and millions of people were urged to stay home to curb the spread. The majority of the Earth's population was no longer going about many of their daily tasks.
With such a disruption to our lives and the global economy, we wondered what changes did we see in the atmosphere? To answer that, the SOS Education team at NOAA took a deep dive into the data and visualizations from the first six months of 2020 to examine the environmental impacts from so many people staying home. This live program highlights what we found.
We recommend using the Live Program Script in conjunction with your presentation and taking a look at the story map before you have an audience. You will also find the script modified in the Presentation Notes on the SOS Remote App. To view instructions for using Live Programs with the iPad Remote App click here.
Resources
Permalink to ResourcesBibliography and Data Sources
Permalink to Bibliography and Data SourcesThe majority of the dataset visualizations were created by the NOAA Science On a Sphere team at NOAA Office of Education and NOAA Research Global Systems Laboratory using ArcGIS, Adobe, and Science On a Sphere tools. The data sources are listed here.
- NOAA Chemical Sciences Laboratory Photo: COVID Air Quality Study
- NOAA Research: "Research & Data on Economic Slowdown Due to COVID-19"
- Economic extent of lockdown restrictions: IEA Global Energy Review 2020
- COVID Cases: Our World in Data; Oxford Martin School, University of Oxford
- Global Lockdowns: COVID-19 Government Response Tracker; Blavatnik School of Government, University of Oxford
- Disney Parking Lot and George Washington Bridge: Google Earth Pro
- Gasoline and Diesel Consumption Graphs: Harkins, C., et al. (2021). "A fuel-based method for updating mobile source emissions during the COVID-19 pandemic." Environmental Research Letters 16.
- Ship Tracks: MarineCadastre.gov Vessel Traffic Data
- Air Traffic photos: flightradar24 Live Air Traffic
- Nitrogen Dioxide TROPOMI Copernicus Sentinel-5 Observations: Tropospheric Emission Monitoring Internet Service
- Nitrogen dioxide information: NASA Earthdata COVID-19 Dashboard
- Nitrogen dioxide 3-D: Benjah-bmm27
- Tehran Air Quality photo: Fars Media Corporation
- Air Quality Index Legend: U.S. Environmental Protection Agency
- Air Quality Index: The World Air Quality Project
- Aerosol Optical Depth Quick Guide: Space Science and Engineering Center, University of Wisconsin-Madison
- Aerosol Optical Depth Data & Images: Satellite - NOAA Suomi NPP Sensor Visible Infrared Imaging Radiometer Suite; Visualization - Shobha Kondragunta (NOAA/NESDIS) and Hai Zhang (IM Systems Group)
- New Normals in Air Quality: "COVID-19 Induced Fingerprints of a New Normal Urban Air Quality in the United States"
- NOAA Quotes: "Pandemic's Cleaner Air Could Reshape What We Know About the Atmosphere" New York Times
- World Health Organization: Air Pollution
- National Institutes of Health: "Decrease in hospital admissions for respiratory diseases during the COVID-19 pandemic: a nationwide claims study" National Library of Medicine
- NOAA Carbon Dioxide Changes During Pandemic: "Coronavirus response barely slows rising carbon dioxide" NOAA Research News
- NOAA Climate Change and Carbon Dioxide: Climate.gov
- CIRES Guide to CO2 Fluctuations: "Why are seasonal CO2 Fluctuations Strongest at Northern Latitudes?"
- IEA CO2 Rebound: "After steep drop in early 2020, global carbon dioxide emissions have rebounded strongly" iea.org