Wave Heights - Hurricane Sandy 2012
Details
Permalink to Details- Added to the Catalog
- Available for
- SOS
- Categories
- Air: Tropical Cyclones, Weather
- Water: Ocean Monitoring
- Keywords
- Casualties
- Heights
- Hurricanes
- Oceans
- Sandy
- Severe Weather
- Tropical Cyclones
- Wave Heights
- Waves
- Wind
Description
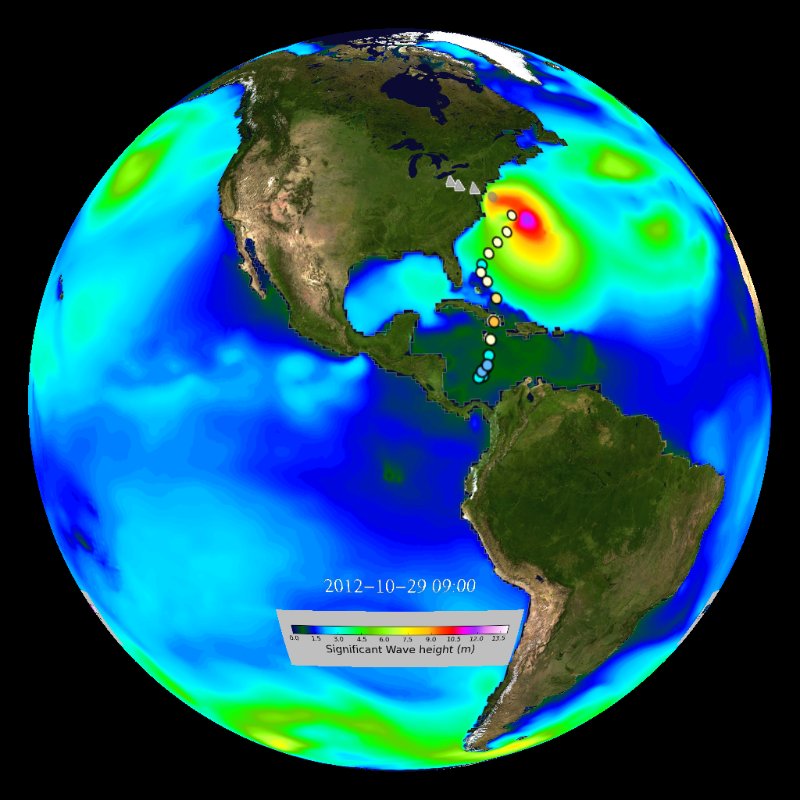
Permalink to DescriptionMeteorological offices worldwide forecast ocean wave heights for the shipping and fisheries industry. In the United States, NOAA's National Weather Service provides the wave forecasts. Just like in weather forecasting, scientists run numerical models to make these predictions. This movie shows wave height calculations of a wave model called 'WAVEWATCH III'. The movie shows 3 hourly model output over October 1st - October 31st, 2012.
On October 22nd 2012, the storm system Sandy started forming in the Caribbean Sea and moved towards the Antilles while intensifying. By Oct 24th, Sandy became a hurricane and made landfall near Kingston, Jamaica. Passing over land weakened the storm for some time, but winds picked up and hit Cuba and the Bahamas on Oct 25th. Again, the storm system briefly weakened and then strengthened again. On Oct 29th, Hurricane Sandy took an unusual course and started curving North-Northwest and moved ashore in New Jersey, affecting New York City.
The entire storm system was exceptionally large with high winds spanning a diameter of 1800 km (1100 miles). This large diameter meant really high waves could develop. The WAVEWATCH III simulations show that the highest significant waves were 13.7m in the open ocean. At the New York harbor entrance, where some of the highest waves have already broken in shallower water, a buoy recorded wave heights of over 9m (32 ft).
In addition to the high local waves, storm surge increases the water level during hurricanes. Increasing water levels are caused both by the low pressure associated with a hurricane and with the water being pushed towards shore and being piled up. The storm surge for Hurricane Sandy increased sea level an additional 10ft near Manhattan, making the waves more impactful and causing much coastal flooding.
High winds, rain and snow, storm surge flooding and high waves caused loss of lives and extensive damage. Over the affected countries almost 150 people were killed. In the USA alone, about 570,000 buildings were heavily damaged. Many beaches along the Eastern US seaboard were eroded by the high waves. Throughout 24 states, there were 8.6 million power outages, trains did not run anymore and 20,000 flights were cancelled. The storm caused extensive flooding in lower Manhattan.
Educational materials have been developed for this dataset, including a few PowerPoint slides, that can be used on a supplementary screen while viewing the dataset on Science On a Sphere®. Also, a discussion-based lesson plan can be used to facilitate student learning about wave heights.
Next Generation Science Standards
Permalink to Next Generation Science StandardsCross-cutting Concepts
Permalink to Cross-cutting ConceptsGrades 3–5
C7 Stability and Change. Students measure change in terms of differences over time, and observe that change may occur at different rates. Students learn some systems appear stable, but over long periods of time they will eventually change.
Notable Features
Permalink to Notable Features- The storm system Sandy traveled over the Greater Antilles, Jamaica, Cuba and the Bahamas and then curved back Northwest to make landfall near New York City.
- Hurricane Sandy was the largest Atlantic hurricane on record with a diameter of 1800 km.
- Wind speeds during Sandy were as high as 185 km/hr.
- WAVEWATCH III calculated wave heights as high as 13.7m.
- Many lives were lost, approximately 148 people were killed in the affected region.
Data Source
Permalink to Data SourceWAVEWATCH III®