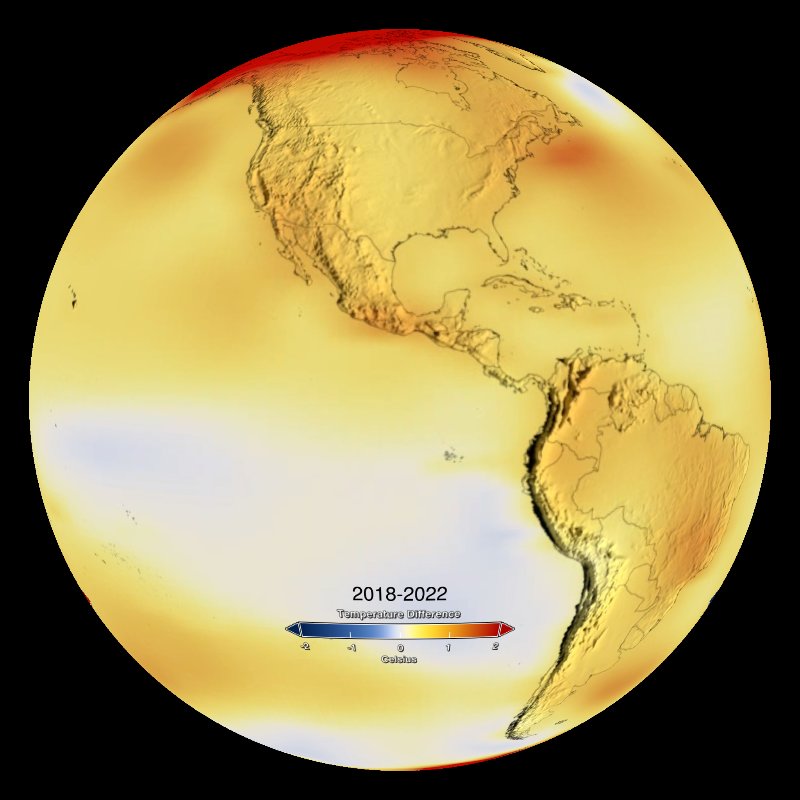
These maps from NASA's Goddard Institute for Space Studies (GISS) show how temperatures have changed worldwide compared to a 1951-1980 baseline. Instead of absolute temperatures, they display anomalies—regions that have warmed or cooled relative to the past.
NASA analyzes data from 6,300 land-based weather stations, satellites, and Antarctic research stations to track temperature changes. The 1951-1980 period includes natural climate patterns like El Niño and La Niña, ensuring comparisons account for typical variations.
Shades of red and orange indicate areas that are warmer than the historical average, while blue areas are cooler. By studying these trends, scientists can better understand climate change and how greenhouse gases influence Earth's temperature.
The warmest year on record is most often the latest year on record.
The Arctic has been warming significantly faster than the rest of the Earth.
The temperature signature of the El Nino Southern Oscillation (ENSO) (warming in El Niño, cooling during la Niña) can be observed in the Equatorial regions of the Pacific.