Temperature Anomaly: Yearly - 500 - 2006 (Paleoclimate Evidence)
Details
Permalink to Details- Added to the Catalog
- Available for
- SOS
- Categories
- Air: Temperature Change, Weather
- People: History
- Keywords
- Climate
- Climate Models
- Coral
- Ice Cores
- Paleoclimate
- Proxy
- Seafloor
- Speleothems
- Temperature
- Tree Rings
Description
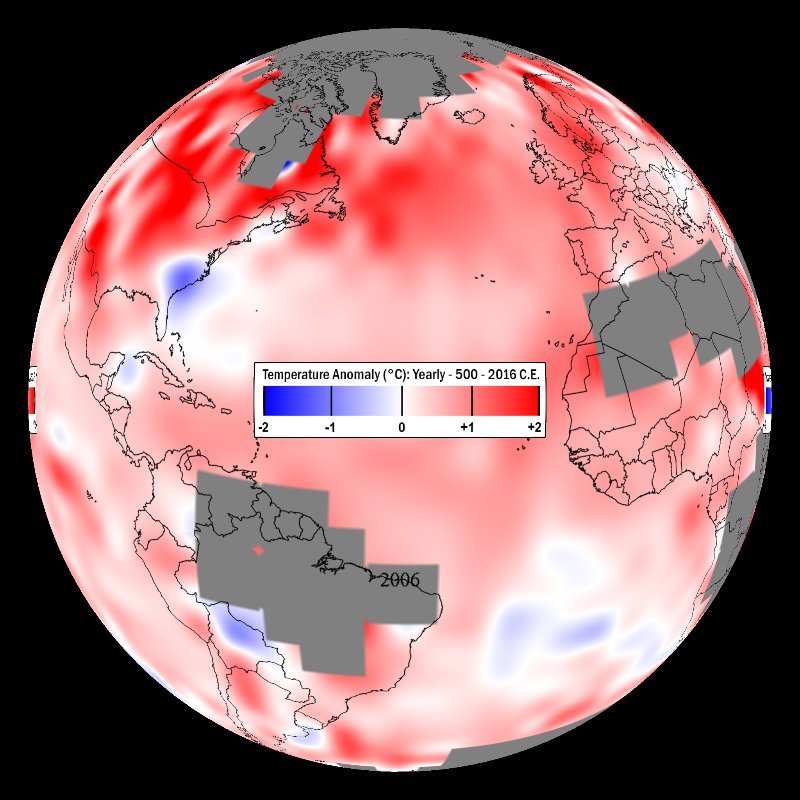
Permalink to DescriptionThis animation shows annual average temperature anomalies (departure from normal) over the globe for the past 1,500 years compared to the average temperature (normal) from 1961-1990. This data collected from over 1,000 paleoclimate proxies. Areas shaded red are warmer than normal while areas shaded blue are cooler than normal.
It's widely understood that global temperatures varied significantly over the last 1,500 years, but much remains to be understood regarding the spatial patterns of variability. For example, during the Medieval period some specific regions were even warmer than we’ve seen over the last decade, but globally the temperatures were cooler. The Medieval period (defined as 950-1250 C.E.) had a tendency for La Nina-like conditions in the tropical Pacific. The coldest temperatures were during the Little Ice Age, observed between 1400 - 1700 C.E., with greatest cooling over the Northern Hemisphere continents outside the tropics.
In this paleo-temperature analysis, the authors used a global climate proxy network to reconstruct surface temperature patterns over this time interval. The values that went into this animation were decadally-smoothed and indicate changes at that time-scale and over longer time periods, rather than year-by-year variations. The grey-masked regions represent areas where insufficient instrumental data existed to allow spatially-explicit calibration in the reconstruction process.
The data from this study are available at from NOAA’s National Centers for Environmental Information (NCEI), World Data Service for Paleoclimatology. See Paleoclimate Proxies SOS dataset to see examples of sources for climate data of the past.
Notable Features
Permalink to Notable Features- Information from over 1,000 paleoclimate proxy data sets was used in developing this temperature reconstruction.
- Areas shaded red are warmer than normal while areas shaded blue are cooler than normal.
- The Medieval period was found to display warmth that matches or exceeds that of the past decade in some regions, but which falls well below recent levels globally.