Satellite Comparison - 1967 & 2017
Details
Permalink to Details- Added to the Catalog
- Available for
- Explorer
- Categories
- Air: Weather
- Space: Satellites
- Keywords
- Satellites
- Weather
- Weather Prediction
Description
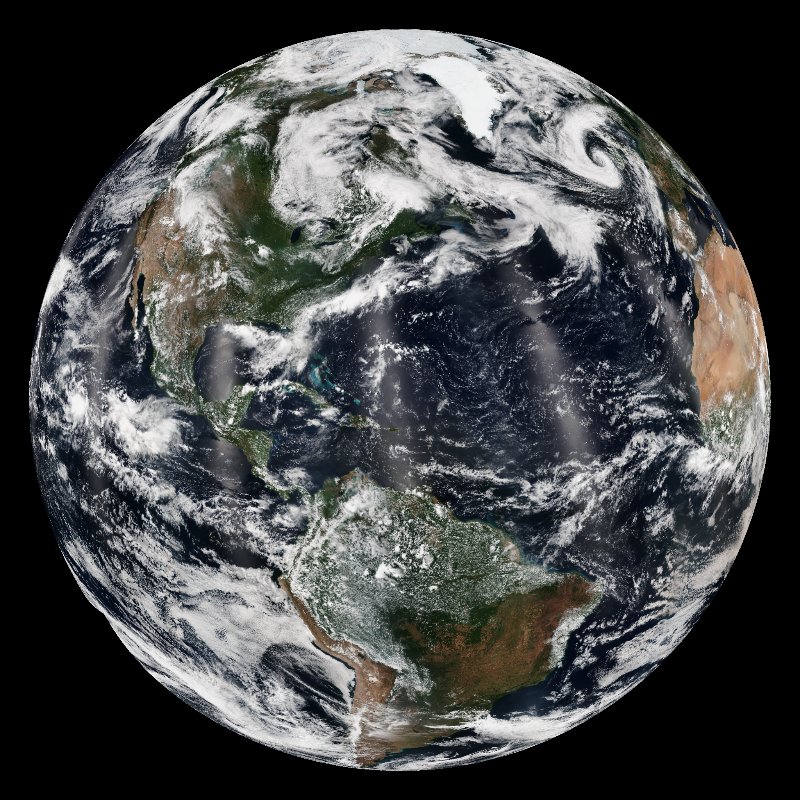
Permalink to DescriptionThis dataset compares satellite images from the first weather satellite, ESSA 1, to a modern one, Suomi NPP, during the same week fifty years apart.
Beginning with Tiros 1 in 1960, the National Weather Service (formally called the U.S. Weather Bureau) has used satellites to understand and forecast the weather. The first Weather Service satellite was ESSA 1 launched in 1966 (Environmental Sciences Services Administration). Visible pictures from that satellite were archived on black and white film. The picture on the left sphere of the dataset shows the first image we recovered from that 35 mm film archive.
Archived data like this might be used to look at specific weather events in the 1960's and 1970's like hurricanes, estimate sea ice extend for the 1960's, or perhaps to derive a cloud climatology from the pictures.
The January, 2017 images come from an SOS dataset called Earth in True Color (daily) - Real-time from a joint NOAA/NASA/DoD operational weather satellite called Suomi NPP.
Next Generation Science Standards
Permalink to Next Generation Science StandardsCross-cutting Concepts
Permalink to Cross-cutting ConceptsGrades 3–5
C1 Patterns. Students identify similarities and differences in order to sort and classify natural objects and designed products. They identify patterns related to time, including simple rates of change and cycles, and to use these patterns to make predictions.
C4 Systems and System Models. Students understand that a system is a group of related parts that make up a whole and can carry out functions its individual parts cannot. They can also describe a system in terms of its components and their interactions.
C7 Stability and Change. Students measure change in terms of differences over time, and observe that change may occur at different rates. Students learn some systems appear stable, but over long periods of time they will eventually change.
Grades 6–8
C1 Patterns. Students recognize that macroscopic patterns are related to the nature of microscopic and atomic-level structure. They identify patterns in rates of change and other numerical relationships that provide information about natural and human designed systems. They use patterns to identify cause and effect relationships, and use graphs and charts to identify patterns in data.
C4 Systems and System Models. Students can understand that systems may interact with other systems; they may have sub-systems and be a part of larger complex systems. They can use models to represent systems and their interactions—such as inputs, processes and outputs—and energy, matter, and information flows within systems. They can also learn that models are limited in that they only represent certain aspects of the system under study.
C7 Stability and Change. Students explain stability and change in natural or designed systems by examining changes over time, and considering forces at different scales, including the atomic scale. Students learn changes in one part of a system might cause large changes in another part, systems in dynamic equilibrium are stable due to a balance of feedback mechanisms, and stability might be disturbed by either sudden events or gradual changes that accumulate over time
Grades 9–12
C1 Patterns. Students observe patterns in systems at different scales and cite patterns as empirical evidence for causality in supporting their explanations of phenomena. They recognize classifications or explanations used at one scale may not be useful or need revision using a different scale; thus requiring improved investigations and experiments. They use mathematical representations to identify certain patterns and analyze patterns of performance in order to re-engineer and improve a designed system.
C4 Systems and System Models. Students can investigate or analyze a system by defining its boundaries and initial conditions, as well as its inputs and outputs. They can use models (e.g., physical, mathematical, computer models) to simulate the flow of energy, matter, and interactions within and between systems at different scales. They can also use models and simulations to predict the behavior of a system, and recognize that these predictions have limited precision and reliability due to the assumptions and approximations inherent in the models. They can also design systems to do specific tasks.
C7 Stability and Change. Students understand much of science deals with constructing explanations of how things change and how they remain stable. They quantify and model changes in systems over very short or very long periods of time. They see some changes are irreversible, and negative feedback can stabilize a system, while positive feedback can destabilize it. They recognize systems can be designed for greater or lesser stability
Disciplinary Core Ideas
Permalink to Disciplinary Core IdeasGrades 3–5
ESS1.B Earth and the Solar System. The Earth’s orbit and rotation, and the orbit of the moon around the Earth cause observable patterns.
ESS2.D Weather & Climate. Climate describes patterns of typical weather conditions over different scales and variations. Historical weather patterns can be analyzed so that they can make predictions about what kind of weather might happen next.
PS4.C Information Technologies and Instrumentation. Patterns can encode, send, receive and decode information.
Grades 6–8
ESS1.B Earth and the Solar System. The solar system contains many varied objects held together by gravity. Solar system models explain and predict eclipses, tides, lunar phases, and seasons.
ESS2.D Weather & Climate. Complex interactions determine local weather patterns and influence climate, including the role of the ocean.
PS4.C Information Technologies and Instrumentation. Waves can be used to transmit digital information. Digitized information is comprised of a pattern of 1s and 0s.
Grades 9–12
ESS1.B Earth and the Solar System. Kepler’s laws describe common features of the motions of orbiting objects. Observations from astronomy and space probes provide evidence for explanations of solar system formation. Changes in Earth’s tilt and orbit cause climate changes such as Ice Ages
ESS2.D Weather & Climate. The role of radiation from the sun and its interactions with the atmosphere, ocean, and land are the foundation for the global climate system. Global climate models are used to predict future changes, including changes influenced by human behavior and natural factors
PS4.A Wave Properties. The wavelength and frequency of a wave are related to one another by the speed of the wave, which depends on the type of wave and the medium through which it is passing. Waves can be used to transmit information and energy.
PS4.C Information Technologies and Instrumentation. Large amounts of information can be stored and shipped around as a result of being digitized.