Protecting Wildlife in a Changing Climate
Details
Permalink to Details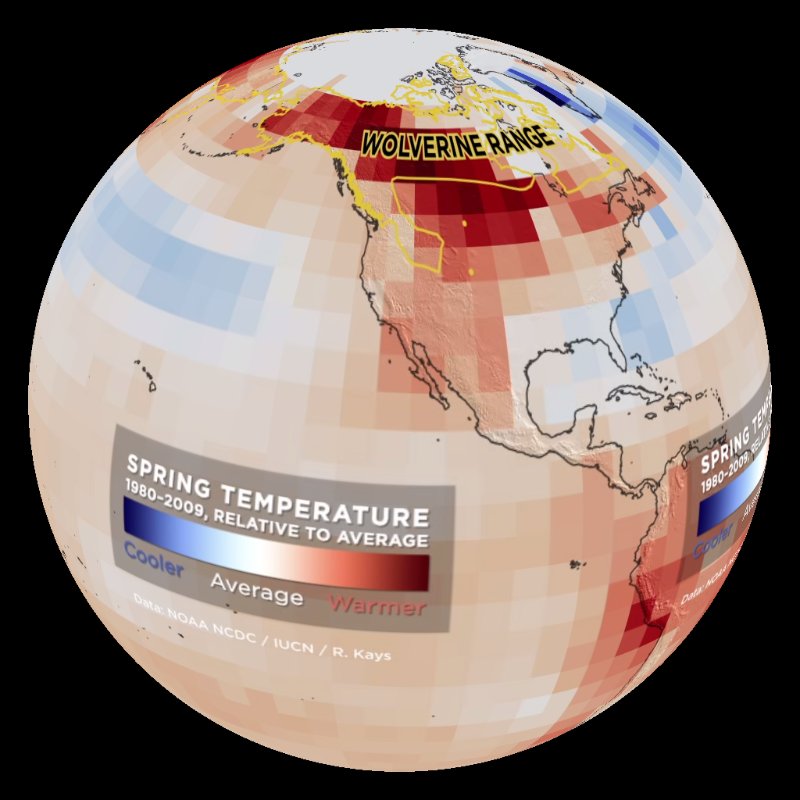
Description
Permalink to DescriptionThis dataset is a companion to a flat-screen data visualization, Protecting Wildlife in a Changing Climate, produced by the American Museum of Natural History's Science Bulletins program.
The FTP link will lead you to two movies: One is AMNH's flat-screen visualization. The second–the SOS dataset–adapts this visualization for Science on a Sphere, but without captions. Also included in the FTP link is a backgrounder, which provides additional content information–helpful for creating live presentations using these datasets.
Synopsis
Permalink to SynopsisAs global climate changes and alters natural habitats, wild animals are shifting where they live on Earth. Protecting them requires connecting crucial protected areas so species can move safely among the habitats they need to survive.
This visualization uses the wolverine as an example–a northern species particularly sensitive to climate change. It maps wolverines' bioclimatic envelope–a model of the specific climatic conditions that the species requires to survive–and then projects ways this envelope may shift as the climate warms. The piece also highlights how connecting habitats with wildlife corridors gives species such as the wolverine a better shot at survival in a warming world.
Data Sources
Permalink to Data Sources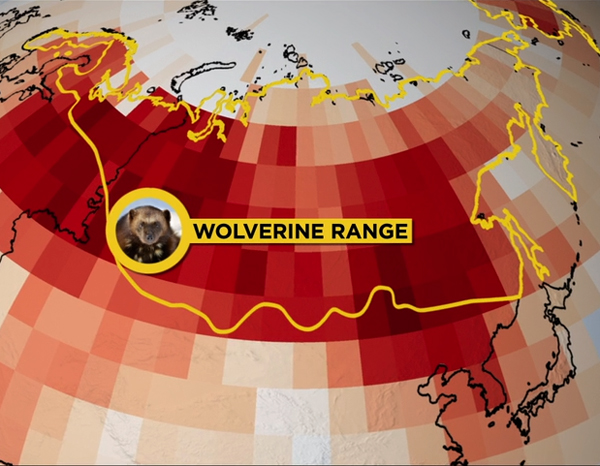
Spring temperature: The red and blue temperature anomaly data reflect the March/April/May average for a 30-year period (1980-2009) relative to the 20th century average. Data provided by NOAA NCDC and processed by Ned Gardiner, NOAA Climate Program Office.
Wolverine range: The yellow outline delineates where wolverines are currently found around the world. Data source: IUCN/Roland Kays.
Wolverine "prime habitat": The mapped yellow area reflects the bioclimatic envelope of wolverine in the United States as of 2012. Data processed by ecoclim.org.
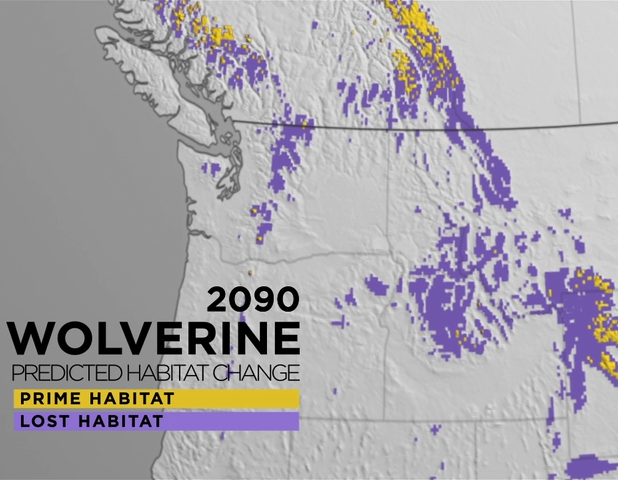
Multidecadal projections: The time series projects the wolverine's bioclimatic envelope in 2040, 2070, and 2090, suggesting how much currently suitable habitat may disappear during each of these scenarios. The pair of 2090 scenarios compares the portion of the bioclimatic envelope that is projected to remain under a "business as usual" trend of greenhouse gas emissions (left; SRES A2) with a level of emissions that reflects a significant effort to transition to greener energy sources (right; SRES B1). Data processed by ecoclim.org.
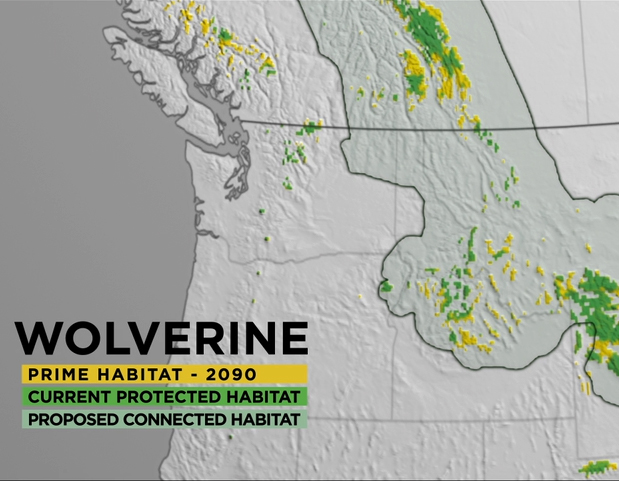
Connected habitat: The green area overlapping the yellow indicates the portion of the wolverine's projected bioclimatic envelope in 2090 that would be within the boundaries of current national parks and other protected areas. The green outline indicates the boundaries of Yellowstone to Yukon, a proposed habitat corridor. (See Backgrounder for more information.)
Protected areas: The green polygons on the last frames of the animation are global protected areas from the World Database of Protected Areas and the US Protected Area Database.