Ocean Color (monthly) - Real-time
Details
Permalink to Details- Added to the Catalog
- Available for
- SOS
- Explorer
- Categories
- Water: Life
- Keywords
- Chlorophyll
- Ocean Color
- Oceans
- Satellites
Description
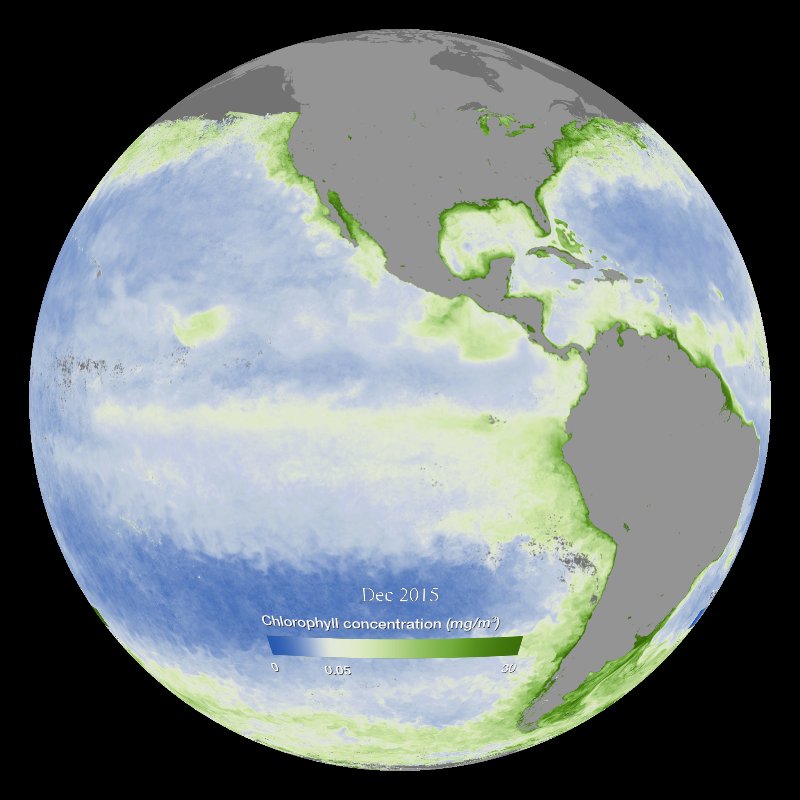
Permalink to DescriptionApproximately 50% of the oxygen we breathe comes from the ocean, where algae not only release oxygen during photosynthesis, but also serve as the base of most oceanic food webs. Since satellites can measure the different wavelengths of light that are absorbed by the planet surface and reflected back to space, scientists can use that data to calculate how much green pigment associated with the algae is contained in the surface waters. Chlorophyll pigment strongly absorbs red and blue wavelengths of light and reflects green. Data from the NASA SeaWiFS, NASA Aqua and NASA/NOAA Suomi NPP satellites have been used by NOAA to monitor oceanic chlorophyll concentration (also called ocean color) since 1997. This data has been instrumental in understanding global productivity, carbon cycling, fisheries habitats, and biochemical oceanography.
In this imagery, areas of the ocean with lower amounts of surface chlorophyll are colored blue, areas with higher concentrations are colored green to yellow. The large patches of gray are areas where the satellite cannot measure the ocean surface due to cloud cover. The areas of gray over the poles during their respective winters is due to the lack of sunlight in those regions. This real-time dataset is updated monthly and frames from the last year are included. In this year long loop, seasonal variations can be seen.
Next Generation Science Standards
Permalink to Next Generation Science StandardsCross-cutting Concepts
Permalink to Cross-cutting ConceptsGrades 3–5
C1 Patterns. Students identify similarities and differences in order to sort and classify natural objects and designed products. They identify patterns related to time, including simple rates of change and cycles, and to use these patterns to make predictions.
C2 Cause and Effect. Students routinely identify and test causal relationships and use these relationships to explain change. They understand events that occur together with regularity might or might not signify a cause and effect relationship
Grades 6–8
C1 Patterns. Students recognize that macroscopic patterns are related to the nature of microscopic and atomic-level structure. They identify patterns in rates of change and other numerical relationships that provide information about natural and human designed systems. They use patterns to identify cause and effect relationships, and use graphs and charts to identify patterns in data.
C2 Cause and Effect. Students classify relationships as causal or correlational, and recognize that correlation does not necessarily imply causation. They use cause and effect relationships to predict phenomena in natural or designed systems. They also understand that phenomena may have more than one cause, and some cause and effect relationships in systems can only be described using probability.
C3 Scale Proportion and Quantity. Students observe time, space, and energy phenomena at various scales using models to study systems that are too large or too small. They understand phenomena observed at one scale may not be observable at another scale, and the function of natural and designed systems may change with scale. They use proportional relationships (e.g., speed as the ratio of distance traveled to time taken) to gather information about the magnitude of properties and processes. They represent scientific relationships through the use of algebraic expressions and equations
Grades 9–12
C1 Patterns. Students observe patterns in systems at different scales and cite patterns as empirical evidence for causality in supporting their explanations of phenomena. They recognize classifications or explanations used at one scale may not be useful or need revision using a different scale; thus requiring improved investigations and experiments. They use mathematical representations to identify certain patterns and analyze patterns of performance in order to re-engineer and improve a designed system.
C2 Cause and Effect. Students understand that empirical evidence is required to differentiate between cause and correlation and to make claims about specific causes and effects. They suggest cause and effect relationships to explain and predict behaviors in complex natural and designed systems. They also propose causal relationships by examining what is known about smaller scale mechanisms within the system. They recognize changes in systems may have various causes that may not have equal effects.
C3 Scale Proportion and Quantity. Students understand the significance of a phenomenon is dependent on the scale, proportion, and quantity at which it occurs. They recognize patterns observable at one scale may not be observable or exist at other scales, and some systems can only be studied indirectly as they are too small, too large, too fast, or too slow to observe directly. Students use orders of magnitude to understand how a model at one scale relates to a model at another scale. They use algebraic thinking to examine scientific data and predict the effect of a change in one variable on another (e.g., linear growth vs. exponential growth).
Disciplinary Core Ideas
Permalink to Disciplinary Core IdeasGrades 3–5
ESS2.C The Roles of Water in Earth's Processes. Most of Earth’s water is in the ocean and much of the Earth’s fresh water is in glaciers or underground.
ESS2.E Biogeology. Living things can affect the physical characteristics of their environment.
LS1.A Structure and Function. Organisms have both internal and external macroscopic structures that allow for growth, survival, behavior, and reproduction.
LS1.C Organization for Energy Flow and Matter in Organisms. Food provides animals with the materials and energy they need for body repair, growth, warmth, and motion. Plants acquire material for growth chiefly from air, water, and process matter and obtain energy from sunlight, which is used to maintain conditions necessary for survival.
LS2.A Interdependent Relationships in Ecosystems. The food of almost any animal can be traced back to plants. Organisms are related in food webs in which some animals eat plants for food and other animals eat the animals that eat plants, while decomposers restore some materials back to the soil.
LS4.D Biodiversity & Humans. Populations of organisms live in a variety of habitats. Change in those habitats affects the organisms living there
Grades 6–8
ESS2.A Earth Materials and Systems. Energy flows and matter cycles within and among Earth’s systems, including the sun and Earth’s interior as primary energy sources. Plate tectonics is one result of these processes.
ESS2.C The Roles of Water in Earth's Processes. Water cycles among land, ocean, and atmosphere, and is propelled by sunlight and gravity. Density variations of sea water drive interconnected ocean currents. Water movement causes weathering and erosion, changing landscape features.
LS1.A Structure and Function. All living things are made up of cells. In organisms, cells work together to form tissues and organs that are specialized for particular body functions
LS1.C Organization for Energy Flow and Matter in Organisms. Plants use the energy from light to make sugars through photosynthesis. Within individual organisms, food is broken down through a series of chemical reactions that rearrange molecules and release energy.
LS2.A Interdependent Relationships in Ecosystems. Organisms and populations are dependent on their environmental interactions both with other living things and with nonliving factors, any of which can limit their growth. Competitive, predatory, and mutually beneficial interactions vary across ecosystems but the patterns are shared.
LS2.B Cycles of Matter and Energy Transfer in Ecosystems. The atoms that make up the organisms in an ecosystem are cycled repeatedly between the living and nonliving parts of the ecosystem. Food webs model how matter and energy are transferred among producers, consumers, and decomposers as the three groups interact within an ecosystem.
Grades 9–12
ESS2.A Earth Materials and Systems. Feedback effects exist within and among Earth’s systems.The geological record shows that changes to global and regional climate can be caused by interactions among changes in the sun’s energy output or Earth’s orbit, tectonic events, ocean circulation, volcanic activity, glaciers, vegetation, and human activities.
ESS2.C The Roles of Water in Earth's Processes. The planet’s dynamics are greatly influenced by water’s unique chemical and physical properties.
LS2.A Interdependent Relationships in Ecosystems. Ecosystems have carrying capacities resulting from biotic and abiotic factors. The fundamental tension between resource availability and organism populations affects the abundance of species in any given ecosystem.
LS2.B Cycles of Matter and Energy Transfer in Ecosystems. Photosynthesis and cellular respiration provide most of the energy for life processes. Only a fraction of matter consumed at the lower level of a food web is transferred up, resulting in fewer organisms at higher levels. At each link in an ecosystem elements are combined in different ways and matter and energy are conserved. Photosynthesis and cellular respiration are key components of the global carbon cycle.
PS4.A Wave Properties. The wavelength and frequency of a wave are related to one another by the speed of the wave, which depends on the type of wave and the medium through which it is passing. Waves can be used to transmit information and energy.
PS4.B Electromagnetic Radiation. Both an electromagnetic wave model and a photon model explain features of electromagnetic radiation broadly and describe common applications of electromagnetic radiation.
Notable Features
Permalink to Notable Features- Seasonal equatorial bio-productive regions
- Occurrences of large algae blooms in the Pacific & Gulf of America
- Effects of the Winter/Summer seasons near the poles
- Movement of the bio-productive front (Transition Zone Chlorophyll Front) in the North Pacific
- The nutrient-rich Antarctic currents off Patagonia
Data Source
Permalink to Data SourceSuomi NPP Chlorophyll Concentration NASA Goddard Space Flight Center: Jan 2012 - May 2015, NOAA STAR Ocean Color Science Team:Jun 2012 - Present