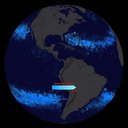
This modeled experiment was conducted to see if it was possible to visualize the so-called ocean garbage patches. It begins with data from floating, scientific buoys that NOAA has been distributing in the oceans for the last 35-year represented as white dots. Since new buoys are continually released, it's hard to tell where older buoys move to. So, if all of the buoys are let go at the same time, it's possible to observe buoy migration patterns. The number of buoys decreases because some buoys don't last as long as others. The buoys migrate to 5 known gyres also called ocean garbage patches.
Along with the buoys, in this visualization, using a computational model of ocean currents called ECCO-2, particles are released evenly around the world allowing the modeled currents carry the particles (cyan/blue). The particles from the model also migrate to the garbage patches. Even though the retimed buoys and modeled particles did not react to currents at the same times, the fact that the data tend to accumulate in the same regions show how robust the result is.
Click here to see the entire Garbage Patch Visualization Experiment at NASA Scientific Visualization Studio.
The dataset used for the ocean buoy visualization is the Global Drifter Database from the GDP Drifter Data Assembly Center, part of the NOAA Atlantic Oceanographic & Meteorological Laboratory. The data covered the period February 1979 through September 2013. Although the actual dataset has a wealth of data, including surface temperatures, salinities, etc., only the buoy positions were used in the visualization.