Loggerhead Sea Turtle Tracks
Details
Permalink to Details- Added to the Catalog
- Available for
- SOS
- Explorer
- Categories
- Water: Life
- Keywords
- Loggerhead Seaturtle
- Migration
- Oceans
- Satellite Tagging
- Tracking
- Turtles
- Wildlife
Description
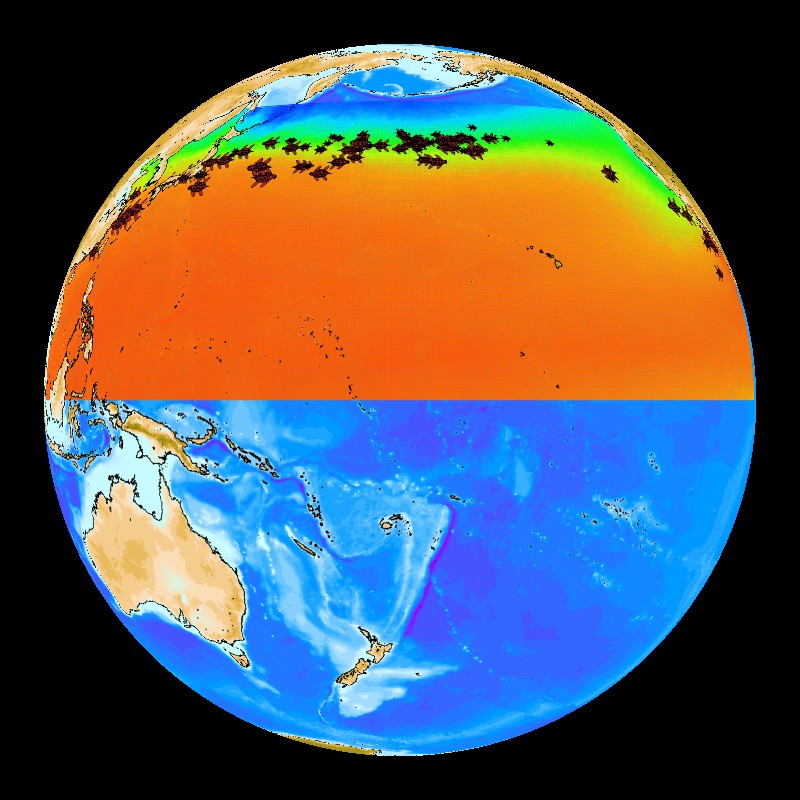
Permalink to DescriptionUsing satellite transmitting tags on wildlife allows scientists to monitor the behaviors of the wildlife in their natural habitats. This dataset contains the tracks of juvenile loggerhead sea turtles that were tagged and monitored. Some of the turtles were caught on commercial fishing vessels north of Hawaii and the other turtles were raised in the hatchery at the Port of Nagoya Aquarium in Japan. After being tagged the turtles were released at various at-sea locations. The data used in this dataset is from 1997 through 2006. The animation represents a daily climatology showing the turtle daily movement, independent of the year. The background is a daily climatology of satellite remotely-sensed sea surface temperature. The size of the turtle graphic is proportional to the turtle length.
Research from the National Marine Fisheries Service has shown that these turtles use surface chlorophyll and temperature gradients to determine their migration habits. In this dataset, the turtles generally remain in a narrow temperature band and move north and south seasonally with that temperature band. Also, the eastern region of the Kuroshio Extension Current near Japan represents an important mid-oceanic foraging hotspot, where many of the turtles in the dataset can be viewed.
Next Generation Science Standards
Permalink to Next Generation Science StandardsCross-cutting Concepts
Permalink to Cross-cutting ConceptsGrades K–2
C1 Patterns. Children recognize that patterns in the natural and human designed world can be observed, used to describe phenomena, and used as evidence
C2 Cause and Effect. Students learn that events have causes that generate observable patterns. They design simple tests to gather evidence to support or refute their own ideas about causes.
Grades 3–5
C1 Patterns. Students identify similarities and differences in order to sort and classify natural objects and designed products. They identify patterns related to time, including simple rates of change and cycles, and to use these patterns to make predictions.
C2 Cause and Effect. Students routinely identify and test causal relationships and use these relationships to explain change. They understand events that occur together with regularity might or might not signify a cause and effect relationship
C3 Scale Proportion and Quantity. Students recognize natural objects and observable phenomena exist from the very small to the immensely large. They use standard units to measure and describe physical quantities such as weight, time, temperature, and volume.
Grades 6–8
C1 Patterns. Students recognize that macroscopic patterns are related to the nature of microscopic and atomic-level structure. They identify patterns in rates of change and other numerical relationships that provide information about natural and human designed systems. They use patterns to identify cause and effect relationships, and use graphs and charts to identify patterns in data.
C2 Cause and Effect. Students classify relationships as causal or correlational, and recognize that correlation does not necessarily imply causation. They use cause and effect relationships to predict phenomena in natural or designed systems. They also understand that phenomena may have more than one cause, and some cause and effect relationships in systems can only be described using probability.
C4 Systems and System Models. Students can understand that systems may interact with other systems; they may have sub-systems and be a part of larger complex systems. They can use models to represent systems and their interactions—such as inputs, processes and outputs—and energy, matter, and information flows within systems. They can also learn that models are limited in that they only represent certain aspects of the system under study.
Grades 9–12
C2 Cause and Effect. Students understand that empirical evidence is required to differentiate between cause and correlation and to make claims about specific causes and effects. They suggest cause and effect relationships to explain and predict behaviors in complex natural and designed systems. They also propose causal relationships by examining what is known about smaller scale mechanisms within the system. They recognize changes in systems may have various causes that may not have equal effects.
C3 Scale Proportion and Quantity. Students understand the significance of a phenomenon is dependent on the scale, proportion, and quantity at which it occurs. They recognize patterns observable at one scale may not be observable or exist at other scales, and some systems can only be studied indirectly as they are too small, too large, too fast, or too slow to observe directly. Students use orders of magnitude to understand how a model at one scale relates to a model at another scale. They use algebraic thinking to examine scientific data and predict the effect of a change in one variable on another (e.g., linear growth vs. exponential growth).
Disciplinary Core Ideas
Permalink to Disciplinary Core IdeasGrades K–2
ESS2.C The Roles of Water in Earth's Processes. Water is found in many types of places and in different forms on Earth
ESS2.D Weather & Climate. Weather is the combination of sunlight, wind, snow or rain, and temperature in a particular region and time. People record weather patterns over time
LS1.C Organization for Energy Flow and Matter in Organisms. Animals obtain food they need from plants or other animals. Plants need water and light.
LS2.B Cycles of Matter and Energy Transfer in Ecosystems. Organisms obtain the materials they need to grow and survive from the environment. Many of these materials come from organisms and are used again by other organisms
Grades 3–5
ESS2.D Weather & Climate. Climate describes patterns of typical weather conditions over different scales and variations. Historical weather patterns can be analyzed so that they can make predictions about what kind of weather might happen next.
ESS3.D Global Climate Change. If Earth’s global mean temperature continues to rise, the lives of humans and other organisms will be affected in many different ways.
LS1.C Organization for Energy Flow and Matter in Organisms. Food provides animals with the materials and energy they need for body repair, growth, warmth, and motion. Plants acquire material for growth chiefly from air, water, and process matter and obtain energy from sunlight, which is used to maintain conditions necessary for survival.
LS2.B Cycles of Matter and Energy Transfer in Ecosystems. Matter cycles between the air and soil and among organisms as they live and die.
LS2.D Social interactions and Group Behaviour. Being part of a group helps animals obtain food, defend themselves, and cope with changes.
LS4.D Biodiversity & Humans. Populations of organisms live in a variety of habitats. Change in those habitats affects the organisms living there
Grades 6–8
ESS2.C The Roles of Water in Earth's Processes. Water cycles among land, ocean, and atmosphere, and is propelled by sunlight and gravity. Density variations of sea water drive interconnected ocean currents. Water movement causes weathering and erosion, changing landscape features.
ESS2.D Weather & Climate. Complex interactions determine local weather patterns and influence climate, including the role of the ocean.
ESS3.C Human Impact on Earth systems. Human activities have altered the biosphere, sometimes damaging it, although changes to environments can have different impacts for different living things. Activities and technologies can be engineered to reduce people’s impacts on Earth.
ESS3.D Global Climate Change. Human activities affect global warming. Decisions to reduce the impact of global warming depend on understanding climate science, engineering capabilities, and social dynamics.
LS2.C Ecosystem Dynamics, Functioning and Resilience. Ecosystem characteristics vary over time. Disruptions to any part of an ecosystem can lead to shifts in all of its populations. The completeness or integrity of an ecosystem’s biodiversity is often used as a measure of its health.
LS4.D Biodiversity & Humans. Changes in biodiversity can influence humans’ resources and ecosystem services they rely on.
Grades 9–12
ESS2.C The Roles of Water in Earth's Processes. The planet’s dynamics are greatly influenced by water’s unique chemical and physical properties.
ESS2.D Weather & Climate. The role of radiation from the sun and its interactions with the atmosphere, ocean, and land are the foundation for the global climate system. Global climate models are used to predict future changes, including changes influenced by human behavior and natural factors
ESS3.C Human Impact on Earth systems. Sustainability of human societies and the biodiversity that supports them requires responsible management of natural resources, including the development of technologies that produce less pollution and waste and that preclude ecosystem degradation.
ESS3.D Global Climate Change. Global climate models used to predict changes continue to be improved, although discoveries about the global climate system are ongoing and continually needed.
LS2.C Ecosystem Dynamics, Functioning and Resilience. If a biological or physical disturbance to an ecosystem occurs, including one induced by human activity, the ecosystem may return to its more or less original state or become a very different ecosystem, depending on the complex set of interactions within the ecosystem
LS2.D Social interactions and Group Behaviour. Group behavior has evolved because membership can increase the chances of survival for individuals and their genetic relatives.
LS4.D Biodiversity & Humans. Biodiversity is increased by formation of new species and reduced by extinction. Humans depend on biodiversity but also have adverse impacts on it. Sustaining biodiversity is essential to supporting life on Earth
Notable Features
Permalink to Notable Features- The size of the turtle graphic is proportional to the turtle length
- Most of the turtles stay in a narrow band within the temperature gradient of the ocean