Lightning Detection - Jun 2011 - Aug 2012
Details
Permalink to Details- Added to the Catalog
- Available for
- SOS
- Explorer
- Categories
- Air: Weather
- Keywords
- Atmosphere
- Lightning
- Severe Weather
- Thunderstorms
- Weather
Description
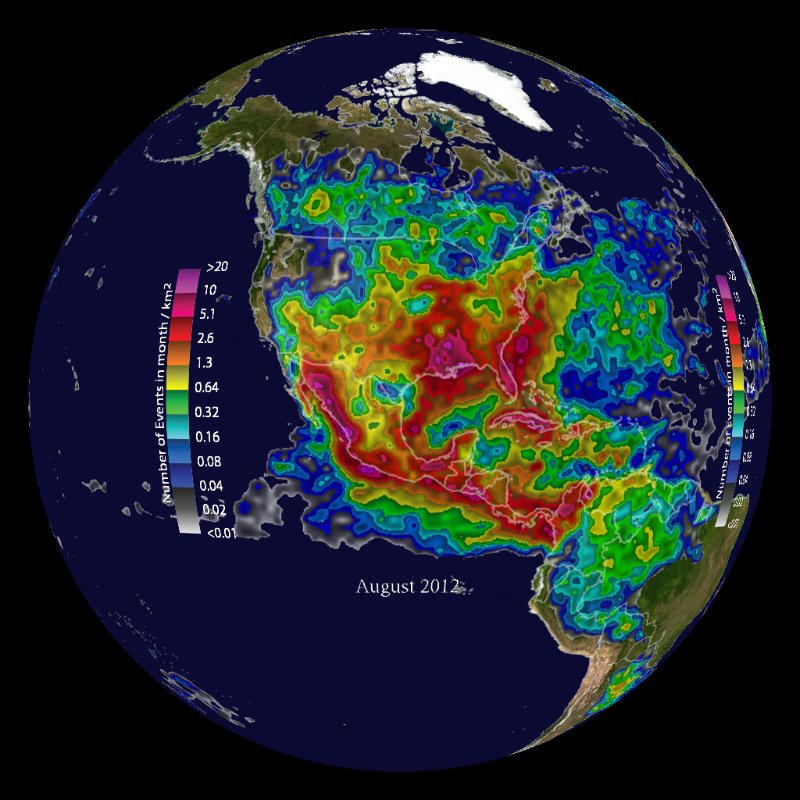
Permalink to DescriptionThe Global Lightning Dataset GLD360 network detects between 1 and 3 million lightning events around the world every day of the year. Lightning activity is not uniformly distributed across the globe. About ten times as many flashes occur over land than over the oceans, and the majority of global lightning is concentrated in the tropics. Over the course of a year, highest flash rate regions follow the inclination of the sun. The northern hemisphere sees more activity during June through August; the southern hemisphere has higher flash rates in January through March. These seasonal patterns can be clearly seen in these images, which show the total number of events detected in each month per square kilometer. The color scale ranges from less than .01 lightning pulses per square kilometer in the corresponding month to over 20 pulses per square kilometer. Each color range corresponds to a factor of two of increase in the number of events. This dataset runs from June 2011 through August 2012.
Global lightning detection is monitored as lightning discharges generate broadband radio pulses that contain a peak component in the Very Low Frequency (VLF; 3-30 kHz) range, which are reflected off of the ground and the conductive region of the upper atmosphere called the ionosphere. GLD360 is a global, real-time long range lightning detection and location network that measures these VLF radio pulses at multiple sensors placed in strategic locations around the globe. The GLD360 network is maintained by Vaisala
Next Generation Science Standards
Permalink to Next Generation Science StandardsCross-cutting Concepts
Permalink to Cross-cutting ConceptsGrades 3–5
C1 Patterns. Students identify similarities and differences in order to sort and classify natural objects and designed products. They identify patterns related to time, including simple rates of change and cycles, and to use these patterns to make predictions.
C3 Scale Proportion and Quantity. Students recognize natural objects and observable phenomena exist from the very small to the immensely large. They use standard units to measure and describe physical quantities such as weight, time, temperature, and volume.
C4 Systems and System Models. Students understand that a system is a group of related parts that make up a whole and can carry out functions its individual parts cannot. They can also describe a system in terms of its components and their interactions.
Grades 6–8
C1 Patterns. Students recognize that macroscopic patterns are related to the nature of microscopic and atomic-level structure. They identify patterns in rates of change and other numerical relationships that provide information about natural and human designed systems. They use patterns to identify cause and effect relationships, and use graphs and charts to identify patterns in data.
C3 Scale Proportion and Quantity. Students observe time, space, and energy phenomena at various scales using models to study systems that are too large or too small. They understand phenomena observed at one scale may not be observable at another scale, and the function of natural and designed systems may change with scale. They use proportional relationships (e.g., speed as the ratio of distance traveled to time taken) to gather information about the magnitude of properties and processes. They represent scientific relationships through the use of algebraic expressions and equations
C5 Energy and Matter. Students learn matter is conserved because atoms are conserved in physical and chemical processes. They also learn within a natural or designed system, the transfer of energy drives the motion and/or cycling of matter. Energy may take different forms (e.g. energy in fields, thermal energy, energy of motion). The transfer of energy can be tracked as energy flows through a designed or natural system.
Grades 9–12
C1 Patterns. Students observe patterns in systems at different scales and cite patterns as empirical evidence for causality in supporting their explanations of phenomena. They recognize classifications or explanations used at one scale may not be useful or need revision using a different scale; thus requiring improved investigations and experiments. They use mathematical representations to identify certain patterns and analyze patterns of performance in order to re-engineer and improve a designed system.
C3 Scale Proportion and Quantity. Students understand the significance of a phenomenon is dependent on the scale, proportion, and quantity at which it occurs. They recognize patterns observable at one scale may not be observable or exist at other scales, and some systems can only be studied indirectly as they are too small, too large, too fast, or too slow to observe directly. Students use orders of magnitude to understand how a model at one scale relates to a model at another scale. They use algebraic thinking to examine scientific data and predict the effect of a change in one variable on another (e.g., linear growth vs. exponential growth).
C5 Energy and Matter. Students learn that the total amount of energy and matter in closed systems is conserved. They can describe changes of energy and matter in a system in terms of energy and matter flows into, out of, and within that system. They also learn that energy cannot be created or destroyed. It only moves between one place and another place, between objects and/or fields, or between systems. Energy drives the cycling of matter within and between systems. In nuclear processes, atoms are not conserved, but the total number of protons plus neutrons is conserved.
Disciplinary Core Ideas
Permalink to Disciplinary Core IdeasGrades 3–5
ESS2.A Earth Materials and Systems. Four major Earth systems interact. Rainfall helps to shape the land and affects the types of living things found in a region. Water, ice, wind, organisms, and gravity break rocks, soils, and sediments into smaller pieces and move them around
ESS2.D Weather & Climate. Climate describes patterns of typical weather conditions over different scales and variations. Historical weather patterns can be analyzed so that they can make predictions about what kind of weather might happen next.
ESS3.B Natural Hazards. A variety of hazards result from natural processes; humans cannot eliminate hazards but can reduce their impacts.
PS3.A Definitions of Energy. Moving objects contain energy. The faster the object moves, the more energy it has. Energy can be moved from place to place by moving objects, or through sound, light, or electrical currents. Energy can be converted from one form to another form.
Grades 6–8
ESS2.A Earth Materials and Systems. Energy flows and matter cycles within and among Earth’s systems, including the sun and Earth’s interior as primary energy sources. Plate tectonics is one result of these processes.
ESS2.D Weather & Climate. Complex interactions determine local weather patterns and influence climate, including the role of the ocean.
ESS3.B Natural Hazards. Mapping the history of natural hazards in a region and understanding related geological forces can help forecast the locations and likelihoods of future events, such as volcanic eruptions, earthquakes and severe weather.
PS3.A Definitions of Energy. Kinetic energy can be distinguished from the various forms of potential energy. Energy changes to and from each type can be tracked through physical or chemical interactions. The relationship between the temperature and the total energy of a system depends on the types, states, and amounts of matter.
PS4.A Wave Properties. A simple wave model has a repeating pattern with a specific wavelength, frequency, and amplitude, and mechanical waves need a medium through which they are transmitted. This model can explain many phenomena including sound and light. Waves can transmit energy
Grades 9–12
ESS2.A Earth Materials and Systems. Feedback effects exist within and among Earth’s systems.The geological record shows that changes to global and regional climate can be caused by interactions among changes in the sun’s energy output or Earth’s orbit, tectonic events, ocean circulation, volcanic activity, glaciers, vegetation, and human activities.
ESS2.D Weather & Climate. The role of radiation from the sun and its interactions with the atmosphere, ocean, and land are the foundation for the global climate system. Global climate models are used to predict future changes, including changes influenced by human behavior and natural factors
ESS3.B Natural Hazards. Natural hazards and other geological events have shaped the course of human history at local, regional, and global scales. Human activities can contribute to the frequency and intensity of some natural hazards.
PS3.A Definitions of Energy. The total energy within a system is conserved. Energy transfer within and between systems can be described and predicted in terms of energy associated with the motion or configuration of particles (objects).
PS4.A Wave Properties. The wavelength and frequency of a wave are related to one another by the speed of the wave, which depends on the type of wave and the medium through which it is passing. Waves can be used to transmit information and energy.
PS4.B Electromagnetic Radiation. Both an electromagnetic wave model and a photon model explain features of electromagnetic radiation broadly and describe common applications of electromagnetic radiation.
Notable Features
Permalink to Notable Features- Ten times more lightning occurs over land than over ocean
- Seasonal patterns can be seen as flash rates increase during summer months
- Color bar ranges from .01 to 20 pulses per square kilometer during a month