 Science On a Sphere
GFS Forecast Model: Precipitation Totals with MSL Pressure Contours - Real-time
Details
Permalink to Details- Added to the Catalog
- Available for
- SOS
- Categories
- Air: Weather
- Keywords
- Altitude
- Atmosphere
- Elevation
- Forecast
- GFS
- Mean Sea Level Pressure
- Meteorology
- Model
- Precipitation
- Pressure
- Rain
- Snow
- Weather
- Weather Prediction
Description
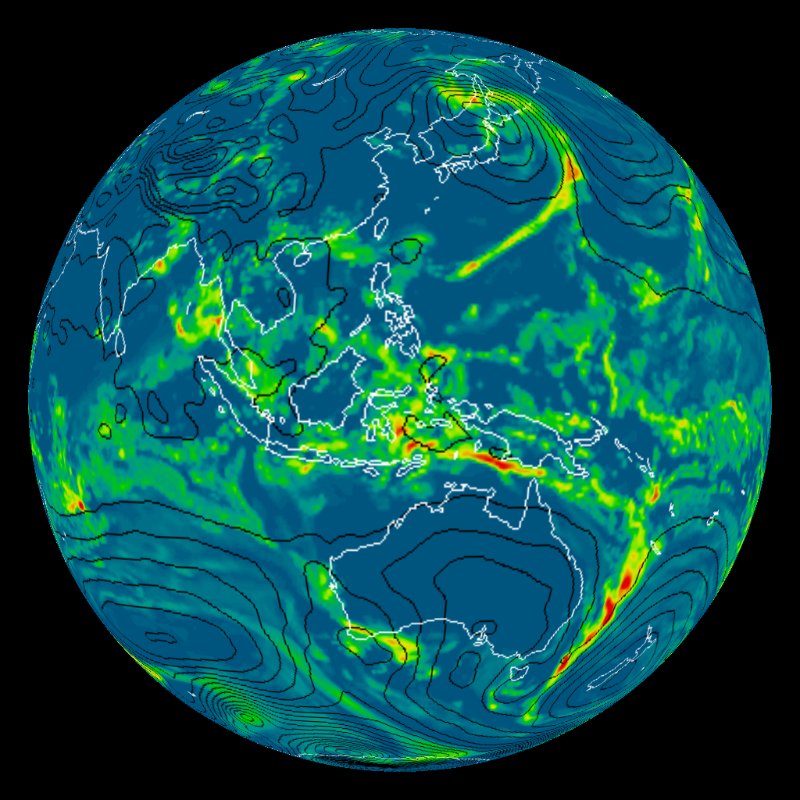
Permalink to DescriptionMeteorologists use many tools to predict the weather. They use past data such as temperature observations, real-time data such as radar and satellite images, and models that look into the future. Many different parameters are plotted using the numerical forecast models, which are generated using computers. The models consist of numerical equations which use current conditions as the inputs. The resulting outputs are forecasts for what is likely to happen in the future, based on those initial conditions. There are many different models that all attempt to do the same thing. The Global Forecast System model is used in this visualization. Six different outputs are available. One common factor in four of the visualizations is that 500mb heights are plotted. This is an important parameter to meteorologists because it is in the middle of the atmosphere. The 500mb height is the height at which the pressure is 500mb. When the 500mb height is low, there is low pressure at the surface, and when the 500mb height is high, there is high pressure at the surface. Patterns of troughs and ridges, which play a huge part in the weather, can also be seen clearly on the 500mb height plots. The 500mb height is also an indicator of atmospheric temperature.
The six outputs that are available for Science On a Sphere are the 500mb height image and contours, the 500mb height image with mean sea level pressure contours, the precipitable water image with 500mb height contours, the precipitable water image with mean sea level pressure contours, the six hour precipitation totals image with mean sea level pressure contours, and 500 mb height wind speed image with 500 mb height contours. The first one, the 500mb height image and contours, simply depicts the 500mb heights as both an image, with shading varying from red to blue, and contours. The red shading is for high heights and the blue shading is for low heights. The second dataset, the 500mb height image with mean sea level pressure contours, uses the same shading as the first. The difference between these two is that the contours are of the mean sea level pressure. The pressure has to be converted to mean sea level to adjust for places at high altitude. Adjusting the pressure allows meteorologists to pick out areas of high and low pressure. Generally areas with high pressure have clearer, sunnier weather than areas with low pressure, which tend to have cloudier, stormier weather. The third and fourth datasets both use the precipitable water forecast as the background image. The difference between the two is that the third dataset has 500mb heights contours while the fourth dataset has mean sea level pressure contours. Precipitable water is a forecast of how much water vapor there is in the atmosphere. When the water vapor concentration is high, rain is more likely. The red shading is for areas that are forecasted to be have low concentrations of water vapor and the blue shading is for areas that have high concentrations of water vapor and are more likely to receive rain. Notice that the water vapor concentrations tend to be highest to the right of troughs, which generally contain surface low pressure. Related to precipitable water is the six hour precipitation dataset. Rather than showing how much moisture is in the atmsophere, this dataset shows how much precipitation is forecasted to fall during a six hour period. The final dataset shows the 500mb height wind speeds. This dataset can be used to see the position and strength of the jet stream in meters per second.
Each of these outputs is available in real-time. The real-time data are forecasts that predict out to 189 hours (7.5days) in future. Updated model runs are available every six hours. The data is also archived and is available starting February 8, 2006.
Notable Features
Permalink to Notable Features- Available in real-time
- Low 500mb heights indicate low surface pressure, high 500mb heights indicate high surface pressure
- On the precipitable water images, red is for low concentrations of water vapor and blue is for high concentrations of water vapor
Data Source
Permalink to Data SourceGFS