Carbon Monoxide - 2008 - 2011
Details
Permalink to Details- Added to the Catalog
- Available for
- SOS
- Categories
- Air: Chemistry
- Keywords
- Air Pollution
- Atmosphere
- Carbon Monoxide
- Chemistry
- CO
Description
Permalink to DescriptionCarbon Monoxide (CO) is a colorless, odorless gas existing in the atmosphere at levels between 40 and 150 parts per billion (ppb). About 40% of that is produced by burning (combustion) of fossil fuels (coal, oil and natural gas) and biomass (for example, wood in forest fires). CO is the primary consumer of oxidant OH, the "cleansing agent" of the atmosphere. For example, OH "cleanses the air" by converting atmospheric methane (CH4) to CO2, which reduces its global warming potential because methane is a stronger greenhouse gas. OH also breaks down a whole host of other compounds such as benzene, isoprene and halocarbons, which would otherwise give rise to smog and reduce air quality. Therefore, an excess of atmospheric CO leads to a reduction of OH's cleansing capacity. Another reason for measuring CO concentrations is that it is an indicator of combustion, such as forest fires and urban emissions. A large forest fire or emissions from heavy traffic can produce CO concentrations of 200 - 5000 ppb.
Careful measurements of CO concentrations in the global atmosphere have been made by NOAA ESRL for decades. In conjunction with other high quality surface and satellite-based measurements these observations have allowed scientists to study the oxidizing capacity of the atmosphere (via CO's interaction with OH), combustion arising from forest fires, and the effectiveness of policies designed to reduce CO as a pollutant. A computer model of the atmosphere called TM5 was used to create this powerful visualization. TM5 simulates the movement of atmospheric gases globally, using winds and atmospheric mixing as derived from the global weather forecast. The model has been used for the main greenhouse gases carbon dioxide (CO2), methane (CH4), and nitrous oxide (N2O), chemically active species such as ozone (O3), and various aerosols.
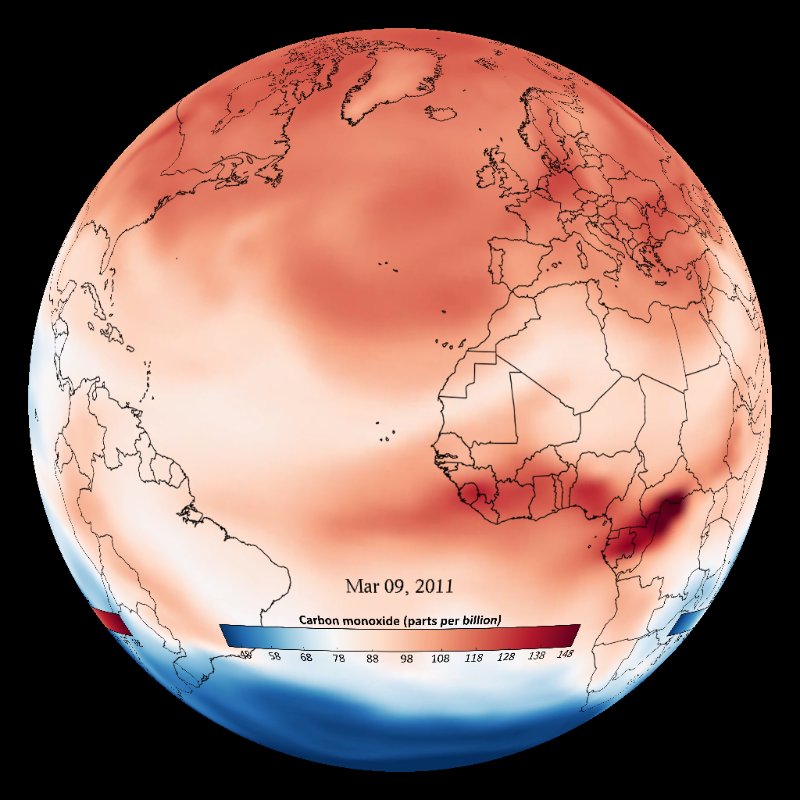
This SOS animation shows total column abundance of CO across the globe, consistent with measurements made at a large number of sites within the NOAA greenhouse gas reference network. The total column abundance, which is the total amount of CO between the surface and the top of the atmosphere, is also expressed in ppb, so that 100 ppb CO would signify the presence of 100 molecules of CO per billion molecules of air.
Fossil fuel burning and fires contribute about 40% of the roughly 2700 Teragrams of CO emitted each year; the remaining 60% come from the oxidation of CH4 and other volatile organic compounds (VOCs). The global average concentration of CO, unlike that of CO2, is fairly constant from year to year, so all the CO produced must be somehow destroyed. About 90% of the destruction is due to oxidation by OH, whereas the other 10% is absorbed by the soil.
In this dataset, one of the most obvious features is the difference in CO concentration between the northern and the southern hemisphere. The northern hemisphere has more sources of CO because most of the fossil fuel emissions are in that hemisphere. The average lifetime of CO is about 2 months, which is much shorter than the time required for concentrations in the two hemispheres to equilibrate. Therefore, the CO produced in the north is destroyed before it can cross the equator and raise concentrations there. As a result, the north is perpetually higher in CO than the south.
The other striking feature is the consistent presence of big patches of CO over Equatorial Africa, India and China. This is due primarily to biomass burning over Africa and industrial activity (coal power plants, cars with inefficient combustion) over India and China. The emissions over India get trapped by the Himalayas, leading to the contrast between India and Tibet in the CO fields.
There are also seasonal variations visible in the dataset. For example, the CO concentration in the northern hemisphere goes down significantly in June, July and August. This is because higher temperatures in the north mean that the air carries more moisture, which produces more OH, which destroys CO faster in the summer. Conversely, the opposite effect is seen in the southern hemisphere, where winter (June - Aug) concentrations of CO are higher than summer (Dec - Feb) concentrations of CO.
Globally, the production of CO from biomass burning has two main seasons. March to May is dry season in northern tropical and temperate Asia, so in those seasons big red patches of CO can be seen over China, India and SE Asia. August to October is the dry season in the southern extra-tropics, so you see large red patches of biomass burning over southern Amazonia and sub-Saharan Africa. And lastly, December and January are biomass burning seasons in equatorial Africa. Of course, the exact timing and magnitude of these different fires vary from year to year. For example, in Amazonia 2010 was an unusually large biomass burning year, a fact evident from comparing August and September 2010 with the same months in other years.
Finally, you will sometimes see patches of blue (i.e., reduction from background values) right next to bright red patches (e.g., March 2008 over NE China and March 2010 over SE China). These are not real atmospheric signals, but rather artifacts of our limited measurement coverage. If we had more atmospheric measurements of CO over those "blue patches", they would go away because we would be able to better estimate the true atmospheric state of CO.
Notable Features
Permalink to Notable Features- Nearly half of all carbon monoxide produced each year is a product of combustion including fossil fuel and biomass burning as well as forest fires.
- More CO in the northern hemisphere is because most of the fossil fuels are burned there.
- Year-long plumes over Africa, India and China are due to consistent biomass and industrial activity.
- Seasonal cycles show that in the summer months (different months in each hemispheres) CO concentrations are lower because of a higher presence OH - due to warm, humid air - destroying CO.
- Also noticeable in different locations at different times is the biomass burning seasons - the dry seasons. For example, you can see red plumes in equatorial Africa during December and January.
Data Source
Permalink to Data SourceNOAA/ESRL GMD Carbon Cycle Greenhouse Gases group, Global Greenhouse Gas Reference Network