Buoy and Float Locations
Details
Permalink to Details- Added to the Catalog
- Available for
- SOS
- Explorer
- Categories
- Water: Ocean Monitoring
- Keywords
- Acidification
- Argo
- Buoy
- C-Man
- DART Buoys
- El Nino
- La Nina
- Measurements
- Nature Of Science
- Oceans
- TAO/Triton
- Tsunamis
Description
Permalink to DescriptionBuoys and floats are deployed on or along the coastline and out into the open ocean in order to gain a better understanding of how the oceans work and how they are changing. The ocean, which covers 71% of planet Earth, is like our planet’s heart. NOAA checks the pulse of the coasts and oceans with a variety of observing systems across all parts of NOAA. Checking the pulse of the ocean over time allows us to document and understand changes in the ocean, and better predict future impacts. Like headlights on a car at night, the further we can see, the more time we have to react. Without continued and sustained observations like these, we cannot forecast the weather, safeguard healthy fisheries and economies, or protect lives and property.
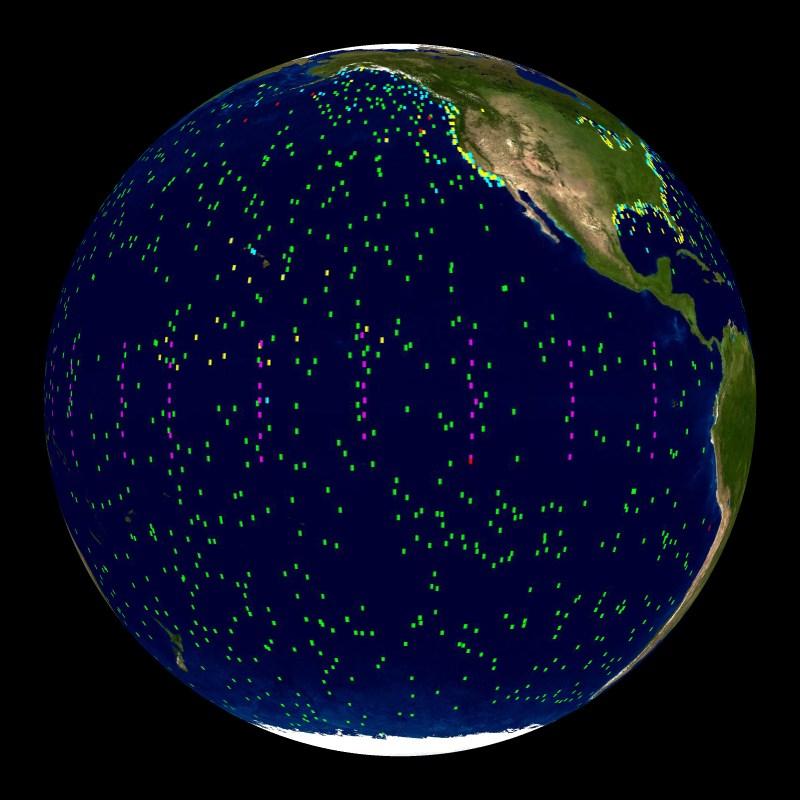
Each dot on this visualization represents an individual buoy or float, and the color indicates the type of instrument. Each of these instruments measures a different set of parameters that might include parameters like sea level pressure, temperature, salinity, water level, or pH. There is another layer that shows pictures of different types of buoys and provides more context for their size, location, and purpose.
Argo
Permalink to ArgoThe blue are floats in the Argo network. NOAA is a leader in the international Argo Program with participation by NOAA Research's Global Ocean Monitoring and Observing Program (GOMO), Atlantic Oceanographic and Meteorological Laboratory (AOML) and the Pacific Marine Environmental Laboratory (PMEL). The Argo Program supports a global array of about 4,000 robotic profiling floats that measure the temperature and salinity of the ocean.
NDBC Meteorological / Ocean Buoys
Permalink to NDBC Meteorological / Ocean BuoysThe NOAA National Data Buoy Center Meteorological / Ocean buoys, pictured as orange, include over 100 moored Weather buoys, and approximately 50 C-MAN - Coastal-Marine Automated Network - stations. C-MAN stations are located on lighthouses, on beaches, on islands close to the shore, and on platforms located offshore. These buoys and stations record parameters such as wind speed and direction, wave height, pressure, air temperature, and sea surface temperature.
DART
Permalink to DARTThe red are buoys in the Deep Ocean Assessment and Reporting of Tsunamis (DART) Project, an ongoing effort to maintain and improve the capability for the early detection and real-time reporting of tsunamis. These stations are located in regions with a history of tsunamis. DART is a critical part of the NOAA Tsunami Programexecuted by NOAA's National Weather Service.
TAO
Permalink to TAOThe lime buoys in the Tropical Atmosphere Ocean are part of the TAO/TRITON project. This project is dedicated to El Niño and La Niña, climate patterns in the Pacific Ocean that can affect weather worldwide. Notice that the buoys are arranged in parallel lines in the Pacific ocean where El Niño and La Niña occur. These are part of the Global Tropical Moored Buoy Array.
NOS CO-OPS
Permalink to NOS CO-OPSThe cyan markers are National Ocean Service (NOS) Center for Operational Oceanographic Products and Services (CO-OPS) stations. NOS CO-OPS provides accurate, reliable, and timely tide, water level, current data, and other vital coastal oceanographic and meteorological information. CO-OPS developed and supports the NOAA Tides and Currents website.
IOOS
Permalink to IOOSThe green markers are National Ocean Service (NOS) Integrated Ocean Observing System (IOOS) network locations. Including both Regional and National Platforms.
National Estuarine Research Reserve System
Permalink to National Estuarine Research Reserve SystemThe purple markers are National Estuarine Research Reserve System (NERRS) System-wide Monitoring Program (SWMP) stations. Each reserve operates at least one weather, four water quality and four nutrient/pigment monitoring stations.
Marine METAR
Permalink to Marine METARThe yellow markers are Meteorological Aerodrome Report (METAR) station locations for marine locations. METAR is a format for weather reporting used mostly by pilots and meteorologists. METAR reports are issued every hour and include wind, visibility, present weather phenomena, sky conditions, temperature, etc.
International Partners
Permalink to International PartnersThe red markers are buoys and moorings supported by International Partners. For example, this includes PIRATA and RAMA, two other parts of the Global Tropical Moored Buoy Array, a multi-national effort to provide data in real-time for climate research and forecasting.
Ocean Acidification Program Moorings
Permalink to Ocean Acidification Program MooringsThe maroon markers are the NOAA Ocean Acidification Program (OAP) funded Moorings and time-series, part of the NOAA Ocean Acidification Observing Network. These buoys record CO2 at the surface and in air every 3 hours to capture both seasonal and year-to-year variability.
The number and location of the buoys and floats in this visualization are from Spring 2025 therefore the locations might be different for some or all of the buoys and floats in the visualization. Some of the floats are constantly on the move (ex: Argo) while others have been replaced, have stopped working, or have been added since the data for this visualization were downloaded.
Content Creation Details
Permalink to Content Creation DetailsData was obtained as a CSV file and cleaned using spreadsheet software. Python code was developed to create the frames.
Next Generation Science Standards
Permalink to Next Generation Science StandardsCross-cutting Concepts
Permalink to Cross-cutting ConceptsGrades 6–8
C1 Patterns. Students recognize that macroscopic patterns are related to the nature of microscopic and atomic-level structure. They identify patterns in rates of change and other numerical relationships that provide information about natural and human designed systems. They use patterns to identify cause and effect relationships, and use graphs and charts to identify patterns in data.
C7 Stability and Change. Students explain stability and change in natural or designed systems by examining changes over time, and considering forces at different scales, including the atomic scale. Students learn changes in one part of a system might cause large changes in another part, systems in dynamic equilibrium are stable due to a balance of feedback mechanisms, and stability might be disturbed by either sudden events or gradual changes that accumulate over time
Grades 9–12
C1 Patterns. Students observe patterns in systems at different scales and cite patterns as empirical evidence for causality in supporting their explanations of phenomena. They recognize classifications or explanations used at one scale may not be useful or need revision using a different scale; thus requiring improved investigations and experiments. They use mathematical representations to identify certain patterns and analyze patterns of performance in order to re-engineer and improve a designed system.
C7 Stability and Change. Students understand much of science deals with constructing explanations of how things change and how they remain stable. They quantify and model changes in systems over very short or very long periods of time. They see some changes are irreversible, and negative feedback can stabilize a system, while positive feedback can destabilize it. They recognize systems can be designed for greater or lesser stability
Disciplinary Core Ideas
Permalink to Disciplinary Core IdeasGrades 6–8
ESS2.C The Roles of Water in Earth's Processes. Water cycles among land, ocean, and atmosphere, and is propelled by sunlight and gravity. Density variations of sea water drive interconnected ocean currents. Water movement causes weathering and erosion, changing landscape features.
ESS2.D Weather & Climate. Complex interactions determine local weather patterns and influence climate, including the role of the ocean.
ESS3.B Natural Hazards. Mapping the history of natural hazards in a region and understanding related geological forces can help forecast the locations and likelihoods of future events, such as volcanic eruptions, earthquakes and severe weather.
ESS3.D Global Climate Change. Human activities affect global warming. Decisions to reduce the impact of global warming depend on understanding climate science, engineering capabilities, and social dynamics.
PS4.A Wave Properties. A simple wave model has a repeating pattern with a specific wavelength, frequency, and amplitude, and mechanical waves need a medium through which they are transmitted. This model can explain many phenomena including sound and light. Waves can transmit energy
PS4.C Information Technologies and Instrumentation. Waves can be used to transmit digital information. Digitized information is comprised of a pattern of 1s and 0s.
Grades 9–12
ESS2.C The Roles of Water in Earth's Processes. The planet’s dynamics are greatly influenced by water’s unique chemical and physical properties.
ESS2.D Weather & Climate. The role of radiation from the sun and its interactions with the atmosphere, ocean, and land are the foundation for the global climate system. Global climate models are used to predict future changes, including changes influenced by human behavior and natural factors
ESS3.B Natural Hazards. Natural hazards and other geological events have shaped the course of human history at local, regional, and global scales. Human activities can contribute to the frequency and intensity of some natural hazards.
ESS3.D Global Climate Change. Global climate models used to predict changes continue to be improved, although discoveries about the global climate system are ongoing and continually needed.
PS4.A Wave Properties. The wavelength and frequency of a wave are related to one another by the speed of the wave, which depends on the type of wave and the medium through which it is passing. Waves can be used to transmit information and energy.
PS4.C Information Technologies and Instrumentation. Large amounts of information can be stored and shipped around as a result of being digitized.
Data Source
Permalink to Data SourceWorld Meteorological Organization Intergovernmental Oceanographic Commission (WMO-IOC) Joint Centre for Oceanography and Marine Meteorology in situ Observations Programmes Support - OceanOPS Dashboard