Rivers: Daily Discharge - 2010
Details
Permalink to Details- Added to the Catalog
- Available for
- SOS
- Categories
- Land: Water
- Water: Freshwater
- Keywords
- Climate
- Climate Zones
- Hydrology
- Land
- Land Use
- Model
- Monsoon
- Rain
- Rivers
- Seasons
- Snowmelt
- Temperature
- Vegetation
- Water
- Water Cycle
Description
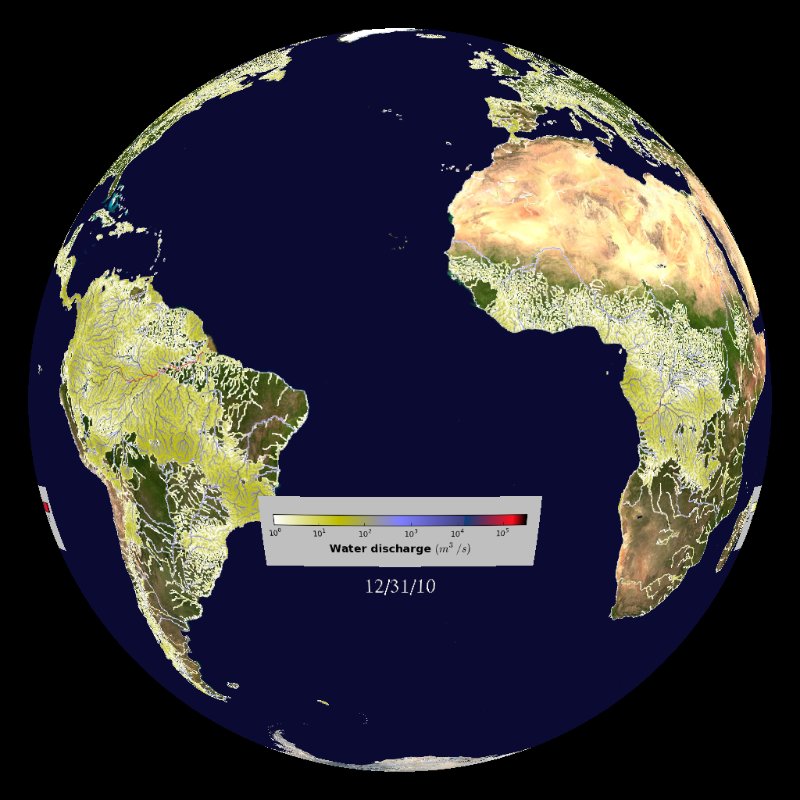
Permalink to DescriptionThis dataset illustrates hydrological conditions worldwide for the year 2010. The data originates from a computational model, the Water Balance Model (WBM). WBM takes daily rainfall and temperature data, maps of vegetation, land-use, irrigation and soil properties, and then calculates the hydrological balance for each of its grid cells.
You can see the effect of large storms moving over the Earth's land masses - as they dump rain and snow the runoff can be seen as the pulsating dark yellow areas throughout entire regions and river basins. Using the magnifying glass (zoom feature on the iPad remote app) you can view some of the largest rivers in the world as their discharge seasonally changes. The largest river in the world is the Amazon River in South America. It encompasses almost 40% of South America, and its drainage basin is in the subtropical climate zone. Much of the Amazon basin is wet from January to June, seen as bright red. Extensive flooding happens during this time. The river floodplain widens in places to 50 km wide, and people have adapted to this flooding by building floating houses, or houses on stilts.
Other large river systems fluctuate even more due to seasonal rainfall. The Ganges and Brahmaputra Rivers in India and Bangladesh, and the Mekong River in Laos, Cambodia, and Vietnam receive almost all of their rainfall from June to September during the Asian monsoon season. River discharge peaks in August and September in this region in Asia. Farmers in India, Bangladesh, and Vietnam use the monsoonal rain water to irrigate their rice crops, while in the dry season the fields may lay fallow. Use the magnifying glass to see the Congo River in Africa discharge increase starting in March and the Yangtze River in China increase in June.
Another aspect of the seasonality of the hydrological cycle is illustrated by the melt of snow. In the model, snow will only melt when temperatures are warm enough. Snow melt on warm days can be seen in April in the northern states of the US, and it progresses further northward over the spring and summer. Arctic Rivers like the Mackenzie River in Canada have large peaks in their runoff in May or June due to the contribution of snow melt.
This global hydrology model was run for 50 years at a daily time step with climatological data ingested from a compiled dataset of 1000's of meteorological stations (Cohen et al., 2013). The model routes runoff to streams and rivers and ultimately river water drains downstream to the ocean. 2010 was chosen as the example year, and you can see what was the daily average of water discharge (in m3/sec) for each model pixel of roughly 55 x 55 km. A logarithmic color scale was used because discharge in the headwaters can be orders of magnitudes smaller (light-green) than accumulated discharge from many tributary rivers in the most downstream parts of large river basins (up to red).
Educational materials have been developed for this dataset, including a few PowerPoint slides, that can be used on a supplementary screen while viewing the dataset on Science On a Sphere® or in a classroom. Also, a discussion-based lesson plan as well as an answer key, which can be used to facilitate student learning about global river discharge differences and changes.
References:
Permalink to References:Cohen, S., Kettner, A., Syvitski, J., Fekete, B., 2013. WBMsed, a distributed global-scale riverine sediment flux model: Model description and validation
Wisser, D., Fekete,B.M., Vorosmarty, C.J., Schumann, A.H., 2010. Reconstructing 20th century global hydrography : a contribution to the Global Terrestrial Network-Hydrology (GTN-H). Hydrology and Earth System Sciences 14(1), 1-24.
Click here for detailed information about the Water Balance Model.
Notable Features
Permalink to Notable Features- Pulses of dark yellow indicate storm runoff in regions and river basins, at the same time the rivers carrying the runoff turn purple.
- Logarithmic scale indicates the magnitudes of difference between the discharge in rivers on earth, i.e. Colorado River vs. Amazon River.
- Ganges and Mekong Rivers in Asia discharge the most water during the Asian monsoon - June to September.
- Congo River in Africa increases flow around March.
- North American northern rivers peak near the end of spring - May or June.