Surface Temperature
Details
Permalink to Details- Added to the Catalog
- Available for
- SOS
- Explorer
- Categories
- Air: Weather
- Water: Temperature
- Keywords
- Earth Observing System
- Land
- Oceans
- Satellites
- Seasons
- SST
- Surface Temperature
- Temperature
- Weather
Description
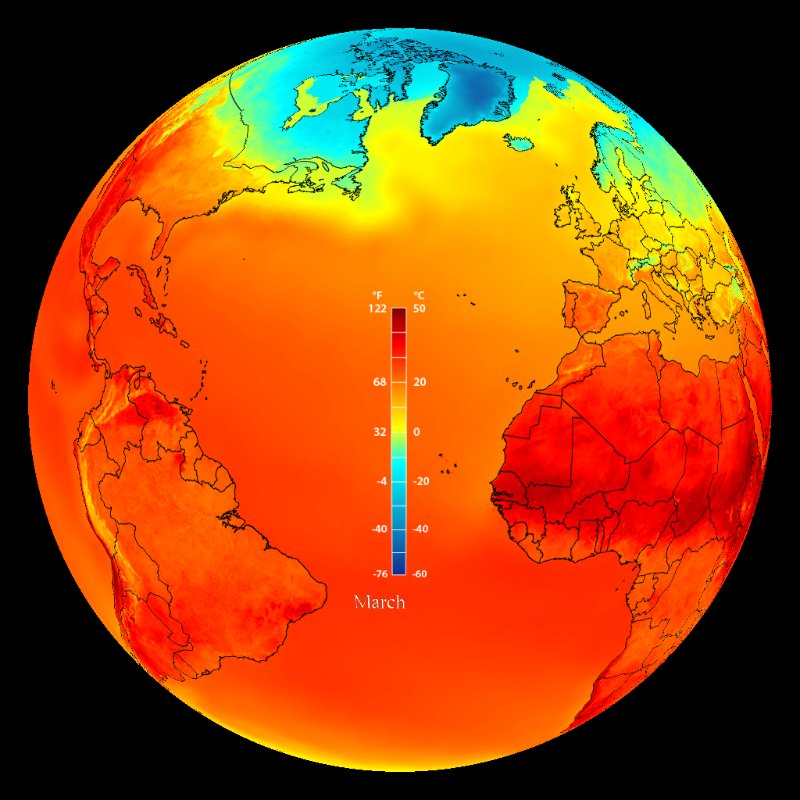
Permalink to DescriptionThese maps combine high-resolution daytime surface temperatures derived from satellite observations for both land and sea and display them with a common color scale. Displaying these high-resolution data with a common color scale makes evident the large difference between surface heating on land versus the sea. It also shows the relatively small seasonal variation in sea surface temperature over the globe relative to land temperatures. The larger seasonal variation in average temperature of the northern hemisphere relative to the southern hemisphere, a result of the larger land area in the northern hemisphere, is also evident.
Land surface temperature data are from the MODIS sensor on NASA's Terra satellite while the sea surface temperatures (SST) are from the Advanced Microwave Scanning Radiometer - Earth Observing System (AMSR-E) sensor on NASA's Aqua satellite. Both source datasets are monthly composite averages used to minimize holes in the daily data created by cloud cover. Despite the compositing, there are still holes in data coverage from cloud cover as well as gaps between land and sea data created by floating sea ice. These holes are filled by lower-resolution source data derived from the Atmospheric Infrared Sounder instrument (AIRS) instrument aboard the Aqua satellite.
Data for this dataset is from:
- Land: MODIS/Terra Land Surface Temperature/Emissivity Monthly L3 Global 0.05Deg CMG V005
- SST: AMSR-E/Aqua Monthly L3 Global Ascending/Descending .25x.25 deg Ocean Grids V002
- Data used to patch holes: AIRS/Aqua Level 3 Monthly standard physical retrieval (AIRS+AMSU) V005 (AIRX3STM) at GES DISC
Next Generation Science Standards
Permalink to Next Generation Science StandardsCross-cutting Concepts
Permalink to Cross-cutting ConceptsGrades 3–5
C1 Patterns. Students identify similarities and differences in order to sort and classify natural objects and designed products. They identify patterns related to time, including simple rates of change and cycles, and to use these patterns to make predictions.
C2 Cause and Effect. Students routinely identify and test causal relationships and use these relationships to explain change. They understand events that occur together with regularity might or might not signify a cause and effect relationship
C3 Scale Proportion and Quantity. Students recognize natural objects and observable phenomena exist from the very small to the immensely large. They use standard units to measure and describe physical quantities such as weight, time, temperature, and volume.
C5 Energy and Matter. Students learn matter is made of particles and energy can be transferred in various ways and between objects. Students observe the conservation of matter by tracking matter flows and cycles before and after processes and recognizing the total weight of substances does not change.
Grades 6–8
C1 Patterns. Students recognize that macroscopic patterns are related to the nature of microscopic and atomic-level structure. They identify patterns in rates of change and other numerical relationships that provide information about natural and human designed systems. They use patterns to identify cause and effect relationships, and use graphs and charts to identify patterns in data.
C2 Cause and Effect. Students classify relationships as causal or correlational, and recognize that correlation does not necessarily imply causation. They use cause and effect relationships to predict phenomena in natural or designed systems. They also understand that phenomena may have more than one cause, and some cause and effect relationships in systems can only be described using probability.
C3 Scale Proportion and Quantity. Students observe time, space, and energy phenomena at various scales using models to study systems that are too large or too small. They understand phenomena observed at one scale may not be observable at another scale, and the function of natural and designed systems may change with scale. They use proportional relationships (e.g., speed as the ratio of distance traveled to time taken) to gather information about the magnitude of properties and processes. They represent scientific relationships through the use of algebraic expressions and equations
C5 Energy and Matter. Students learn matter is conserved because atoms are conserved in physical and chemical processes. They also learn within a natural or designed system, the transfer of energy drives the motion and/or cycling of matter. Energy may take different forms (e.g. energy in fields, thermal energy, energy of motion). The transfer of energy can be tracked as energy flows through a designed or natural system.
Grades 9–12
C1 Patterns. Students observe patterns in systems at different scales and cite patterns as empirical evidence for causality in supporting their explanations of phenomena. They recognize classifications or explanations used at one scale may not be useful or need revision using a different scale; thus requiring improved investigations and experiments. They use mathematical representations to identify certain patterns and analyze patterns of performance in order to re-engineer and improve a designed system.
C5 Energy and Matter. Students learn that the total amount of energy and matter in closed systems is conserved. They can describe changes of energy and matter in a system in terms of energy and matter flows into, out of, and within that system. They also learn that energy cannot be created or destroyed. It only moves between one place and another place, between objects and/or fields, or between systems. Energy drives the cycling of matter within and between systems. In nuclear processes, atoms are not conserved, but the total number of protons plus neutrons is conserved.
C7 Stability and Change. Students understand much of science deals with constructing explanations of how things change and how they remain stable. They quantify and model changes in systems over very short or very long periods of time. They see some changes are irreversible, and negative feedback can stabilize a system, while positive feedback can destabilize it. They recognize systems can be designed for greater or lesser stability
Disciplinary Core Ideas
Permalink to Disciplinary Core IdeasGrades 3–5
ESS2.A Earth Materials and Systems. Four major Earth systems interact. Rainfall helps to shape the land and affects the types of living things found in a region. Water, ice, wind, organisms, and gravity break rocks, soils, and sediments into smaller pieces and move them around
ESS2.C The Roles of Water in Earth's Processes. Most of Earth’s water is in the ocean and much of the Earth’s fresh water is in glaciers or underground.
ESS2.D Weather & Climate. Climate describes patterns of typical weather conditions over different scales and variations. Historical weather patterns can be analyzed so that they can make predictions about what kind of weather might happen next.
Grades 6–8
ESS2.A Earth Materials and Systems. Energy flows and matter cycles within and among Earth’s systems, including the sun and Earth’s interior as primary energy sources. Plate tectonics is one result of these processes.
ESS2.C The Roles of Water in Earth's Processes. Water cycles among land, ocean, and atmosphere, and is propelled by sunlight and gravity. Density variations of sea water drive interconnected ocean currents. Water movement causes weathering and erosion, changing landscape features.
ESS2.D Weather & Climate. Complex interactions determine local weather patterns and influence climate, including the role of the ocean.
PS3.A Definitions of Energy. Kinetic energy can be distinguished from the various forms of potential energy. Energy changes to and from each type can be tracked through physical or chemical interactions. The relationship between the temperature and the total energy of a system depends on the types, states, and amounts of matter.
Grades 9–12
ESS2.A Earth Materials and Systems. Feedback effects exist within and among Earth’s systems.The geological record shows that changes to global and regional climate can be caused by interactions among changes in the sun’s energy output or Earth’s orbit, tectonic events, ocean circulation, volcanic activity, glaciers, vegetation, and human activities.
ESS2.C The Roles of Water in Earth's Processes. The planet’s dynamics are greatly influenced by water’s unique chemical and physical properties.
ESS2.D Weather & Climate. The role of radiation from the sun and its interactions with the atmosphere, ocean, and land are the foundation for the global climate system. Global climate models are used to predict future changes, including changes influenced by human behavior and natural factors
PS3.A Definitions of Energy. The total energy within a system is conserved. Energy transfer within and between systems can be described and predicted in terms of energy associated with the motion or configuration of particles (objects).
Notable Features
Permalink to Notable Features- Larger variation in land surface temperature versus sea surface temperature
- Lager seasonal variation in land temperature versus sea surface temperature
- Larger seasonal temperature variation in northern hemisphere versus southern hemisphere (due to greater land mass in the north)
- The ocean's moderating effect on coastal land temperatures. This is most evident in western Europe during the winter.
Data Source
Permalink to Data SourceLand: MODIS/Terra, SST: AMSR-E/Aqua, patch data: AIRS/Aqua